- Phân tích
- Tin tức và các công cụ
- Tin tức thị trường
- Gold Price Forecast: XAU/USD surges on falling US T-bond yields, FOMC’s decision in focus
Gold Price Forecast: XAU/USD surges on falling US T-bond yields, FOMC’s decision in focus
- Gold price rises as falling US Treasury bond yields enhance the appeal of the non-interest-bearing asset.
- May PPI data from the US BLS comes below expectations, supporting the Gold price.
- The US Dollar Index (DXY) falls to a four-week low, expecting a rescue from a hawkish Jerome Powell.
Gold price climbs as the North American session progresses due to falling US Treasury bond yields, ahead of the US Federal Reserve Open Market Committee (FOMC) decision. Another round of inflation data in the United States (US) further cemented the case for a Fed skip but also put a July interest rate increase at risk. At the time of writing, XAU/USD is trading at $1959.12 after hitting a low of $1942.29.
Gold rebounds as the USD weakens and Treasury yields fall; Eyes on the upcoming FOMC decision
US equities are trading mixed ahead of the FOMC’s decision. Data from the US Bureau of Labor Statistics (BLS) showed that inflation on the producer front in May, also known as the Producer Price Index (PPI), expanded at a slower pace than a 1.5% estimate, with yearly data coming at 1.1%. Nevertheless, core PPI rose 2.8% YoY, beneath forecasts of 2.9%, showing that core inflation remains stuck in the side of consumers and producers.
Expectations for the upcoming meeting show that analysts expect Jerome Powell and Co. to keep rates unchanged. Consequently, US Treasury bond yields edge lower, led by the 10-year note yielding 3.786%, down four basis points (bps). US real yields, which influence XAU/USD prices, are under pressure, at 1.584, five (bps) lower from its daily peak, a tailwind for XAU/USD.
In the meantime, the US Dollar Index (DXY), which measures the buck’s value vs. a basket of six currencies, drops 0.54%, at 102.747, its lowest level in four weeks.
The Fed’s decision will also update the central bank’s economic projections and the dot plot. After releasing the monetary policy statement, Fed Chair Jerome Powell will hit the stand, with most traders expecting him to deliver a hawkish message that could emphasize the Fed’s commitment to tackle inflation and keep their options open regarding monetary policy.
XAU/USD Price Analysis: Technical outlook
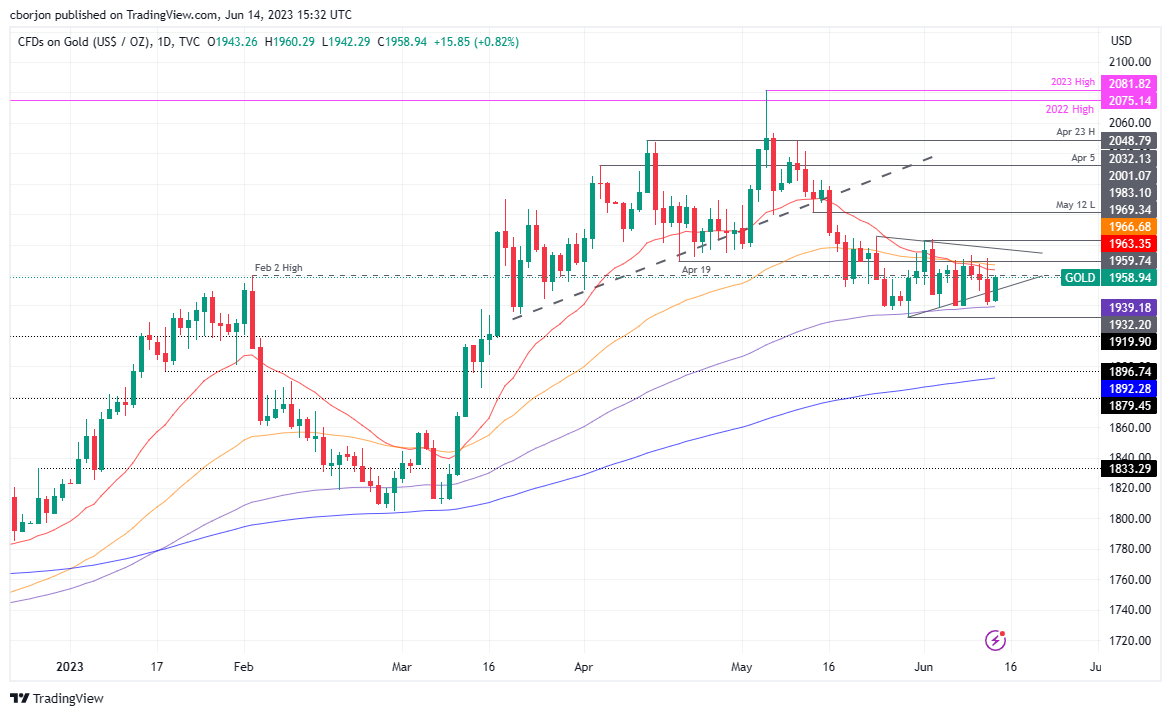
The XAU/USD is trading sideways from a technical perspective, as traders have been waiting for Fed’s June monetary policy decision. However, it should be said that after reaching a new year-to-date (YTD) high of $2081.82, Gold lost almost 6%, piercing down the April 19 swing low of $1959.74.
The XAU/USD has formed a symmetrical triangle on a downtrend, suggesting that further downside is expected. If XAU/USD breaks downwards, the first support would be the 100-day Exponential Moving Average (EMA) at $1939.14, followed by the May 30 daily low of $1932.20. Once cleared, sellers would target the $1900 figure. Conversely, for a bullish resumption, the XAU/USD must claim the intersection of the 20/50-day EMAs at $1963.18/$1966.61, followed by a resistance trendline at around $1970/80.


© 2000-2026. Bản quyền Teletrade.
Trang web này được quản lý bởi Teletrade D.J. LLC 2351 LLC 2022 (Euro House, Richmond Hill Road, Kingstown, VC0100, St. Vincent and the Grenadines).
Thông tin trên trang web không phải là cơ sở để đưa ra quyết định đầu tư và chỉ được cung cấp cho mục đích làm quen.
Giao dịch trên thị trường tài chính (đặc biệt là giao dịch sử dụng các công cụ biên) mở ra những cơ hội lớn và tạo điều kiện cho các nhà đầu tư sẵn sàng mạo hiểm để thu lợi nhuận, tuy nhiên nó mang trong mình nguy cơ rủi ro khá cao. Chính vì vậy trước khi tiến hành giao dịch cần phải xem xét mọi mặt vấn đề chấp nhận tiến hành giao dịch cụ thể xét theo quan điểm của nguồn lực tài chính sẵn có và mức độ am hiểu thị trường tài chính.
Sử dụng thông tin: sử dụng toàn bộ hay riêng biệt các dữ liệu trên trang web của công ty TeleTrade như một nguồn cung cấp thông tin nhất định. Việc sử dụng tư liệu từ trang web cần kèm theo liên kết đến trang teletrade.vn. Việc tự động thu thập số liệu cũng như thông tin từ trang web TeleTrade đều không được phép.
Xin vui lòng liên hệ với pr@teletrade.global nếu có câu hỏi.
ngân hàng