- Phân tích
- Tin tức và các công cụ
- Tin tức thị trường
- Gold Price Forecast: XAU/USD declines towards $1,950 as USD Index recovers ahead of Blinken-Jinping meet
Gold Price Forecast: XAU/USD declines towards $1,950 as USD Index recovers ahead of Blinken-Jinping meet
- Gold price has dropped to near $1,950.00 citing recovery signs in the USD Index.
- Investors are turning cautious ahead of US State of Secretary Antony Blinken meeting China’s President XI Jinping.
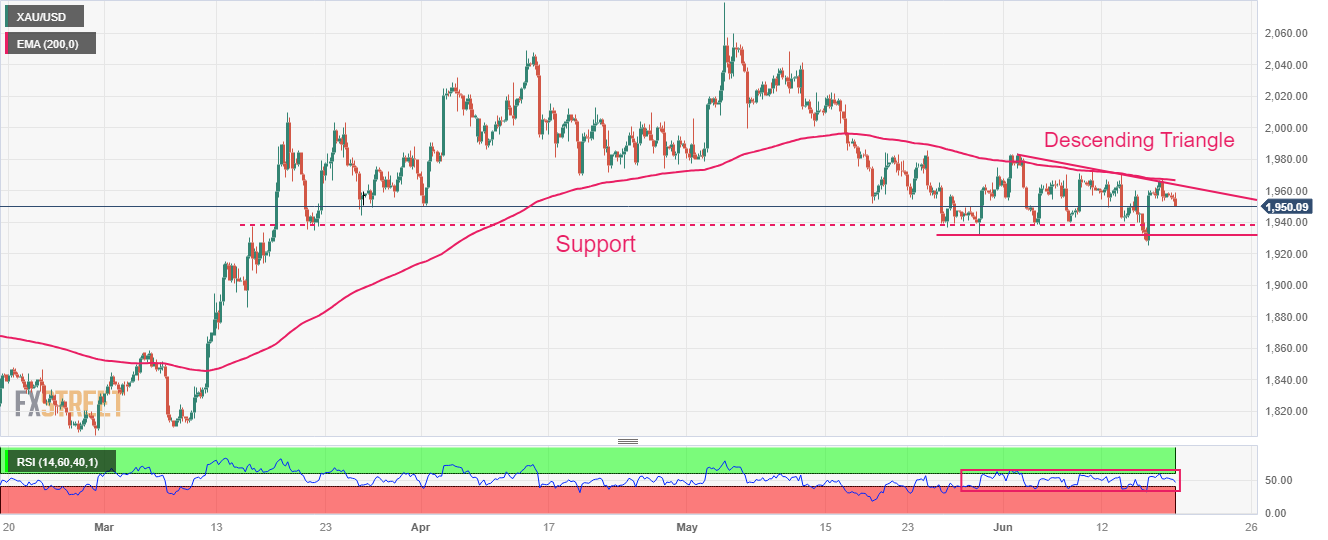
- Gold price has sensed selling pressure from the downward-sloping trendline of the Descending Triangle chart pattern.
Gold price (XAU/USD) has printed a fresh day’s low at $1,952.00 as the US Dollar Index (DXY) has attempted a recovery in the European session. The precious metal is declining towards the crucial support of $1,950.00 as investors are turning cautious ahead of US State of Secretary Antony Blinken's meeting with China’s President XI Jinping.
S&P500 futures are showing nominal gains after recovery losses posted in Asia, which indicates that appeal for US equities is still solid. Investors should note that the overall market mood could turn quiet as US markets will remain closed on Monday on account of Juneteenth.
The US Dollar Index (DXY) has come out of the woods and has climbed to near 103.53. There is a silver line between Federal Reserve’s (Fed) guidance and the expectations of investors for interest rates. Fed Chair Jerome Powell has announced that two small rate hikes are appropriate this year while the street is expecting that the central bank will go with just one hike. United States core inflation is still persistent and labor market conditions are extremely tight, having the potential of denting current expectations.
Elevating caution in the FX domain has also uplifted US Treasury Yields. The yields offered on 10-year US government bonds have jumped above 3.8%.
Gold technical analysis
Gold price has sensed selling pressure from the downward-sloping trendline of the Descending Triangle chart pattern plotted from June 02 high at $1,983.50 on a four-hour scale. The horizontal support is placed from May 30 low at $1,932.12. The broader cushion is placed from March 15 high at $1,937.39.
The 200-period Exponential Moving Average (EMA) at $1,966.70 is acting as a barricade for the Gold bulls, which indicates that the long-term trend is bearish.
Meanwhile, the Relative Strength Index (RSI) (14) is oscillating in the 40.00-60.00 range, portraying a lackluster performance.
Gold four-hour chart


© 2000-2026. Bản quyền Teletrade.
Trang web này được quản lý bởi Teletrade D.J. LLC 2351 LLC 2022 (Euro House, Richmond Hill Road, Kingstown, VC0100, St. Vincent and the Grenadines).
Thông tin trên trang web không phải là cơ sở để đưa ra quyết định đầu tư và chỉ được cung cấp cho mục đích làm quen.
Giao dịch trên thị trường tài chính (đặc biệt là giao dịch sử dụng các công cụ biên) mở ra những cơ hội lớn và tạo điều kiện cho các nhà đầu tư sẵn sàng mạo hiểm để thu lợi nhuận, tuy nhiên nó mang trong mình nguy cơ rủi ro khá cao. Chính vì vậy trước khi tiến hành giao dịch cần phải xem xét mọi mặt vấn đề chấp nhận tiến hành giao dịch cụ thể xét theo quan điểm của nguồn lực tài chính sẵn có và mức độ am hiểu thị trường tài chính.
Sử dụng thông tin: sử dụng toàn bộ hay riêng biệt các dữ liệu trên trang web của công ty TeleTrade như một nguồn cung cấp thông tin nhất định. Việc sử dụng tư liệu từ trang web cần kèm theo liên kết đến trang teletrade.vn. Việc tự động thu thập số liệu cũng như thông tin từ trang web TeleTrade đều không được phép.
Xin vui lòng liên hệ với pr@teletrade.global nếu có câu hỏi.
ngân hàng