- Phân tích
- Tin tức và các công cụ
- Tin tức thị trường
- Gold Price Forecast: XAU/USD looks vulnerable above $1,930 US yields seem well-supported
Gold Price Forecast: XAU/USD looks vulnerable above $1,930 US yields seem well-supported
- Gold price is expected to extend its downside journey below $1,930.00 ahead of Fed Powell’s testimony.
- Investors are eager to know whether Fed Powell would choose a 50 bps rate hike or a data-dependent approach.
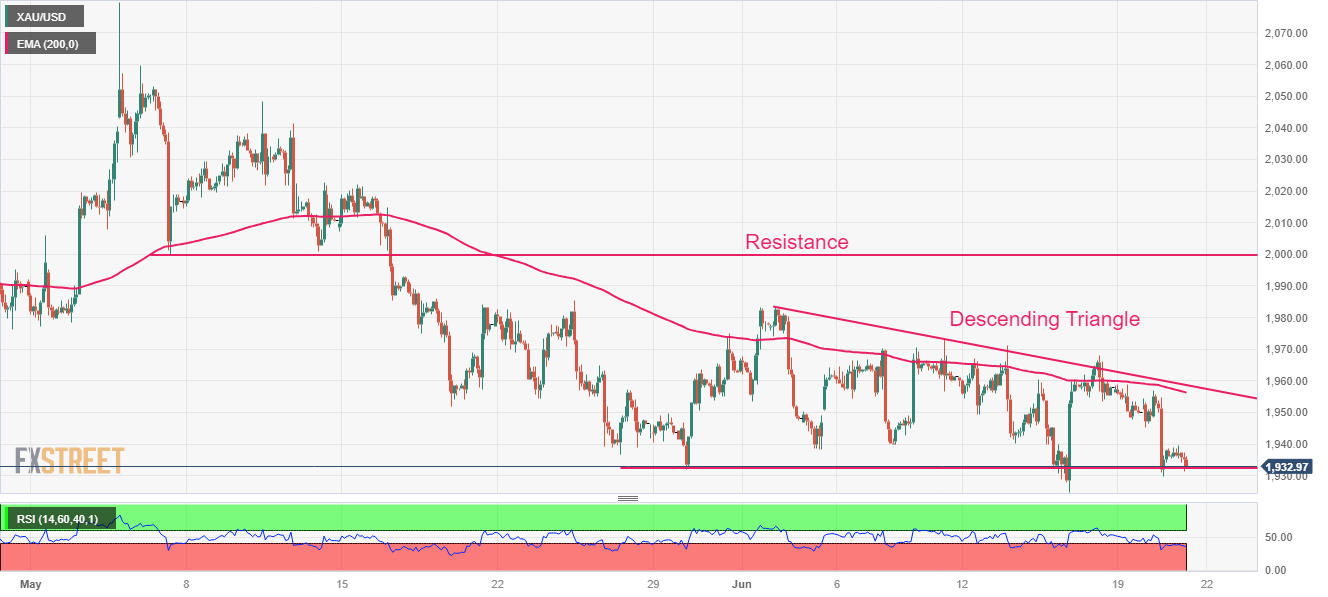
- Gold price is on the edge of the horizontal support of the Descending Triangle pattern.
Gold price (XAU/USD) has concluded its less-confident pullback move to near $1,940.00 in the European session. The precious metal is expected to show further downside below $1930.00 as US Treasury yields have shown resilience ahead of Federal Reserve (Fed) chair Jerome Powell’s testimony.
S&P500 futures have turned flat after choppy moves as investors have sidelined ahead of Fed Powell’s testimony. The US Dollar Index (DXY) is showing topsy-turvy moves around 102.60. A volatile action is anticipated from the USD Index as the street is mixed in Fed’s 50 basis points (bps) interest rate hike vs. data-dependent approach. Contrary to the choppy USD Index, US Treasury yields look firmer. The 10-year US Treasury yields are holding above 3.74%.
Going forward, the entire focus will be on Jerome Powell's words. Economists at ING believe the first week of July is when we’ll get the most important set of data releases in the United States, so Powell’s words can determine whether DXY will end the quarter above or below the 102.00 mark.
Later this week, US weekly jobless claims data will remain in focus. The US Department of Labor has reported higher-than-anticipated first-timer jobless claims straight for the past three weeks. Further jump in claims would convey that labor market conditions are easing further.
Gold technical analysis
Gold price is on edge of the horizontal support of the Descending Triangle chart pattern formed on a two-hour scale, which is placed from May 30 low at $1,932.12. The downward-sloping trendline of the aforementioned chart pattern is plotted from June 02 high at $1,983.00. The 200-period Exponential Moving Average (EMA) at $1,958.84 is acting as a barricade for the Gold bulls. Horizontal resistance is plotted from May 05 low around $2,000.00.
The Relative Strength Index (RSI) (14) has slipped into the bearish range of 20.00-40.00, which indicates that the downside momentum has been triggered.
Gold two-hour chart


© 2000-2026. Bản quyền Teletrade.
Trang web này được quản lý bởi Teletrade D.J. LLC 2351 LLC 2022 (Euro House, Richmond Hill Road, Kingstown, VC0100, St. Vincent and the Grenadines).
Thông tin trên trang web không phải là cơ sở để đưa ra quyết định đầu tư và chỉ được cung cấp cho mục đích làm quen.
Giao dịch trên thị trường tài chính (đặc biệt là giao dịch sử dụng các công cụ biên) mở ra những cơ hội lớn và tạo điều kiện cho các nhà đầu tư sẵn sàng mạo hiểm để thu lợi nhuận, tuy nhiên nó mang trong mình nguy cơ rủi ro khá cao. Chính vì vậy trước khi tiến hành giao dịch cần phải xem xét mọi mặt vấn đề chấp nhận tiến hành giao dịch cụ thể xét theo quan điểm của nguồn lực tài chính sẵn có và mức độ am hiểu thị trường tài chính.
Sử dụng thông tin: sử dụng toàn bộ hay riêng biệt các dữ liệu trên trang web của công ty TeleTrade như một nguồn cung cấp thông tin nhất định. Việc sử dụng tư liệu từ trang web cần kèm theo liên kết đến trang teletrade.vn. Việc tự động thu thập số liệu cũng như thông tin từ trang web TeleTrade đều không được phép.
Xin vui lòng liên hệ với pr@teletrade.global nếu có câu hỏi.
ngân hàng