- Phân tích
- Tin tức và các công cụ
- Tin tức thị trường
- Gold Price Forecast: XAU/USD shows volatile spikes around $1,930 despite Fed sticking to hawkish guidance
Gold Price Forecast: XAU/USD shows volatile spikes around $1,930 despite Fed sticking to hawkish guidance
- Gold price is showing volatile spikes around $1,930.00 amid Fed Powell's testimony at Congress.
- Fed Powell has confirmed that policymakers are in favor of further interest rate hikes this year.
- Gold price is on the edge of the horizontal support of the Descending Triangle chart pattern.
Gold price (XAU/USD) is showing extremely volatile action around $1,930.00 as Federal Reserve (Fed) chair Jerome Powell has sounded hawkish while delivering testimony in front of Congress. The precious metal is strongly defending the $1,930.00 despite Fed Powell having confirmed more rate hikes this year.
S&P500 futures have extended losses further as investors are hoping that expectations of more interest rate hikes from the Federal Reserve (Fed) have pushed the United States economy toward recession. The US Dollar Index (DXY) is showing volatile spikes but is still inside the woods around 102.60. The 10-year US Treasury yields seem choppy around 3.75%.
Fed Powell has confirmed that policymakers are in favor of further interest rate hikes this year as the process of getting inflation back down to 2% has a long way to go. The Fed believes that tight credit conditions are expected to put pressure on economic activities, inflation, and labor market conditions, however, the extent remains uncertain.
Chances of a recession in the United States economy are well solid as more interest rates by the Fed would impact the scales of manufacturing and service activities significantly.
Jerome Powell has confirmed that the central bank will be data-dependent and long-term consumer inflation expectations are well-anchored.
Gold technical analysis
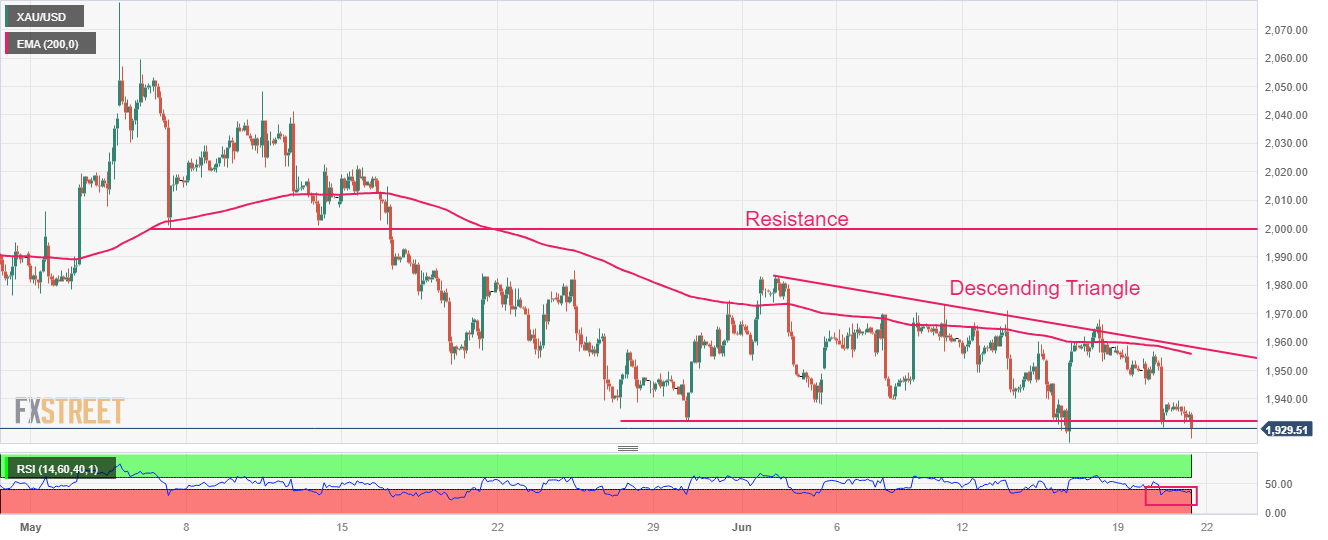
Gold price is on the edge of the horizontal support of the Descending Triangle chart pattern formed on a two-hour scale, which is placed from May 30 low at $1,932.12. The downward-sloping trendline of the aforementioned chart pattern is plotted from June 02 high at $1,983.00. The 200-period Exponential Moving Average (EMA) at $1,958.84 is acting as a barricade for the Gold bulls. Horizontal resistance is plotted from May 05 low around $2,000.00.
The Relative Strength Index (RSI) (14) has slipped into the bearish range of 20.00-40.00, which indicates that the downside momentum has been triggered.
Gold two-hour chart


© 2000-2026. Bản quyền Teletrade.
Trang web này được quản lý bởi Teletrade D.J. LLC 2351 LLC 2022 (Euro House, Richmond Hill Road, Kingstown, VC0100, St. Vincent and the Grenadines).
Thông tin trên trang web không phải là cơ sở để đưa ra quyết định đầu tư và chỉ được cung cấp cho mục đích làm quen.
Giao dịch trên thị trường tài chính (đặc biệt là giao dịch sử dụng các công cụ biên) mở ra những cơ hội lớn và tạo điều kiện cho các nhà đầu tư sẵn sàng mạo hiểm để thu lợi nhuận, tuy nhiên nó mang trong mình nguy cơ rủi ro khá cao. Chính vì vậy trước khi tiến hành giao dịch cần phải xem xét mọi mặt vấn đề chấp nhận tiến hành giao dịch cụ thể xét theo quan điểm của nguồn lực tài chính sẵn có và mức độ am hiểu thị trường tài chính.
Sử dụng thông tin: sử dụng toàn bộ hay riêng biệt các dữ liệu trên trang web của công ty TeleTrade như một nguồn cung cấp thông tin nhất định. Việc sử dụng tư liệu từ trang web cần kèm theo liên kết đến trang teletrade.vn. Việc tự động thu thập số liệu cũng như thông tin từ trang web TeleTrade đều không được phép.
Xin vui lòng liên hệ với pr@teletrade.global nếu có câu hỏi.
ngân hàng