- Phân tích
- Tin tức và các công cụ
- Tin tức thị trường
- Silver Price Analysis: XAG/USD plummets to a two-month low, below the 200-day EMA
Silver Price Analysis: XAG/USD plummets to a two-month low, below the 200-day EMA
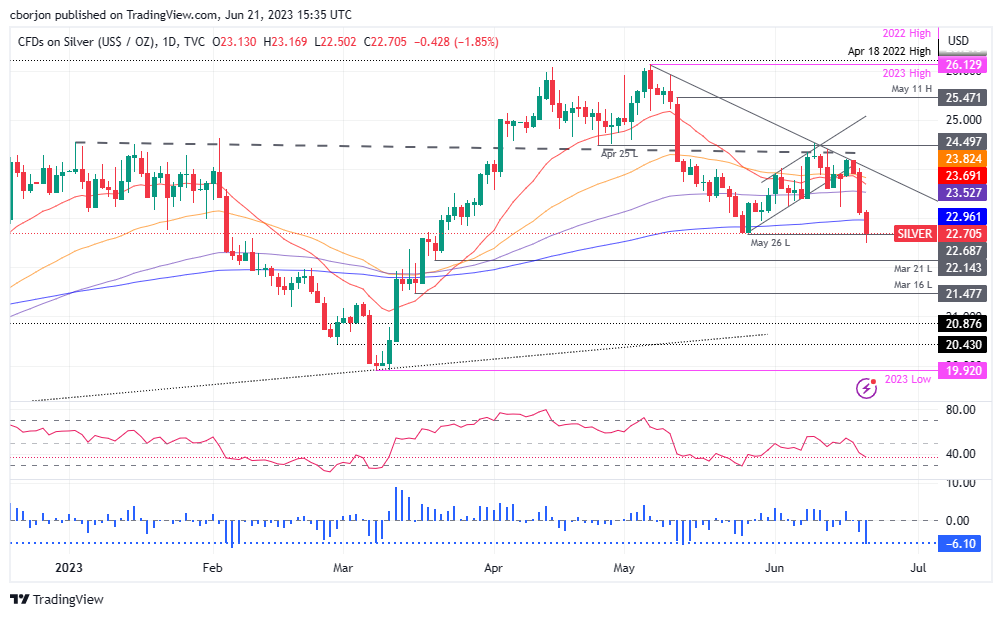
- XAG/USD sinks below key $22.96, the 200-day EMA level.
- Bearish RSI and RoC indicate a strong sell-off, warranting further XAG/USD downside.
- XAG/USD upside resistance was found at a $23.00 handle, followed by a challenge of the 100-day EMA.
Silver price pierces below the 200-day Exponential Moving Average (EMA) of $22.96 as sellers pile in, dragging prices towards a new two-month low of $22.50, as high US Treasury bond yields pressure the precious metals segment. At the time of writing, XAG/USD trades at $22.75, while Gold (XAU/USD) spot exchanges hands at $1931.02, down 1.64% and 0.23%, respectively.
Risk-off sentiment is weighing on the precious metals segment. Investors remain uncertain as the Fed Chair Jerome Powell commences his two-day testimony at the US Congress, which you can follow here. The US 10-year Treasury note yields 3.775% and gains 4.6 bps, while US real yields, directly influencing XAG/USD’s prices, climb five bps to 1.555%.
XAG/USD Price Analysis: Technical outlook
The XAG/USD remains neutral to downward biased, though it could shift to the downside if XAG/USD prints a daily close below the May 25 swing low of $22.68. That would mean the Silver price breaking the 200-day Exponential Moving Average (EMA) threshold and, from a technical perspective, turning XAG/USD bearish.
Further cementing XAG/USD bearish case is the Relative Strength Index (RSI) indicator at negative territory, while the three-day Rate of Change (RoC) continues to plunge as sellers gain momentum.
That said, in that outcome, XAG/USD could dive towards the March 21 daily low at $22.14 before challenging the $22.00 figure. A breach of the latter will expose the March 16 low at $21.47, followed by the $21.00 mark.
Conversely, if XAG/USD reclaims the 200-day EMA, that could expose the $23.00 handle on the upside, followed by the 100-day EMA at $23.52.
XAG/USD Price Action – Daily chart


© 2000-2026. Bản quyền Teletrade.
Trang web này được quản lý bởi Teletrade D.J. LLC 2351 LLC 2022 (Euro House, Richmond Hill Road, Kingstown, VC0100, St. Vincent and the Grenadines).
Thông tin trên trang web không phải là cơ sở để đưa ra quyết định đầu tư và chỉ được cung cấp cho mục đích làm quen.
Giao dịch trên thị trường tài chính (đặc biệt là giao dịch sử dụng các công cụ biên) mở ra những cơ hội lớn và tạo điều kiện cho các nhà đầu tư sẵn sàng mạo hiểm để thu lợi nhuận, tuy nhiên nó mang trong mình nguy cơ rủi ro khá cao. Chính vì vậy trước khi tiến hành giao dịch cần phải xem xét mọi mặt vấn đề chấp nhận tiến hành giao dịch cụ thể xét theo quan điểm của nguồn lực tài chính sẵn có và mức độ am hiểu thị trường tài chính.
Sử dụng thông tin: sử dụng toàn bộ hay riêng biệt các dữ liệu trên trang web của công ty TeleTrade như một nguồn cung cấp thông tin nhất định. Việc sử dụng tư liệu từ trang web cần kèm theo liên kết đến trang teletrade.vn. Việc tự động thu thập số liệu cũng như thông tin từ trang web TeleTrade đều không được phép.
Xin vui lòng liên hệ với pr@teletrade.global nếu có câu hỏi.
ngân hàng