- Phân tích
- Tin tức và các công cụ
- Tin tức thị trường
- AUD/USD falls to monthly low following US PMIs
AUD/USD falls to monthly low following US PMIs
- On Friday's session, the AUD/USD lost more than 1% pips and poised to closed a 2.9% weekly decline
- Negative market sentiment following mixed US PMIs from June weighs on the Aussie.
- Lower US bond yields and losses seen on Wall Street signal flightto-safety flows.
On Friday, the Aussie faced severe selling pressure and the AUD/USD fell to its lowest level since early June towards the 0.6660 area. In that sense, global economic downturn fears following weak UK and Eurozone PMIs, followed then by mixed US PMIs favored a sour market mood and hence benefited the US Dollar.
Investors assess preliminary June PMIs
On Friday, PMIs indicated mixed results for the US in the month of June, according to the S&P Global report. The Manufacturing PMI for June, fell to a five-month low, reaching 46.3, failing to live up to the expectations of 48.3. On the positive side, the Services PMI came slightly above the expectations at 54.1 vs the 54 anticipated by markets. Moreover, the Global Composite PMI dropped to 53 vs the 54.4 expected.
Adding to the negative market environment, the 10-year bond yield declined to a low of 3.70% while the 2-year yield fell to 4.70% and the 5-year to 4%, respectively. Moreover, the S&P 500 index (SPX) is seeing 0.6% losses, the Dow Jones Industrial Average (DJI) a 0.51% decline, and the Nasdaq Composite (NDX) a 0.92% loss.
Regarding the next sessions, attention now turns to next week’s Core Personal Consumption Expenditures (PCE) and Gross Domestic Product (GDP) data from the US where investors will get a clearer outlook of the economic activity and inflation in order to start modeling their expectations towards the next Fed meeting in July. On the Australian side, the focus is the Monthly Consumer Price Index from May.
AUD/USD Levels to watch
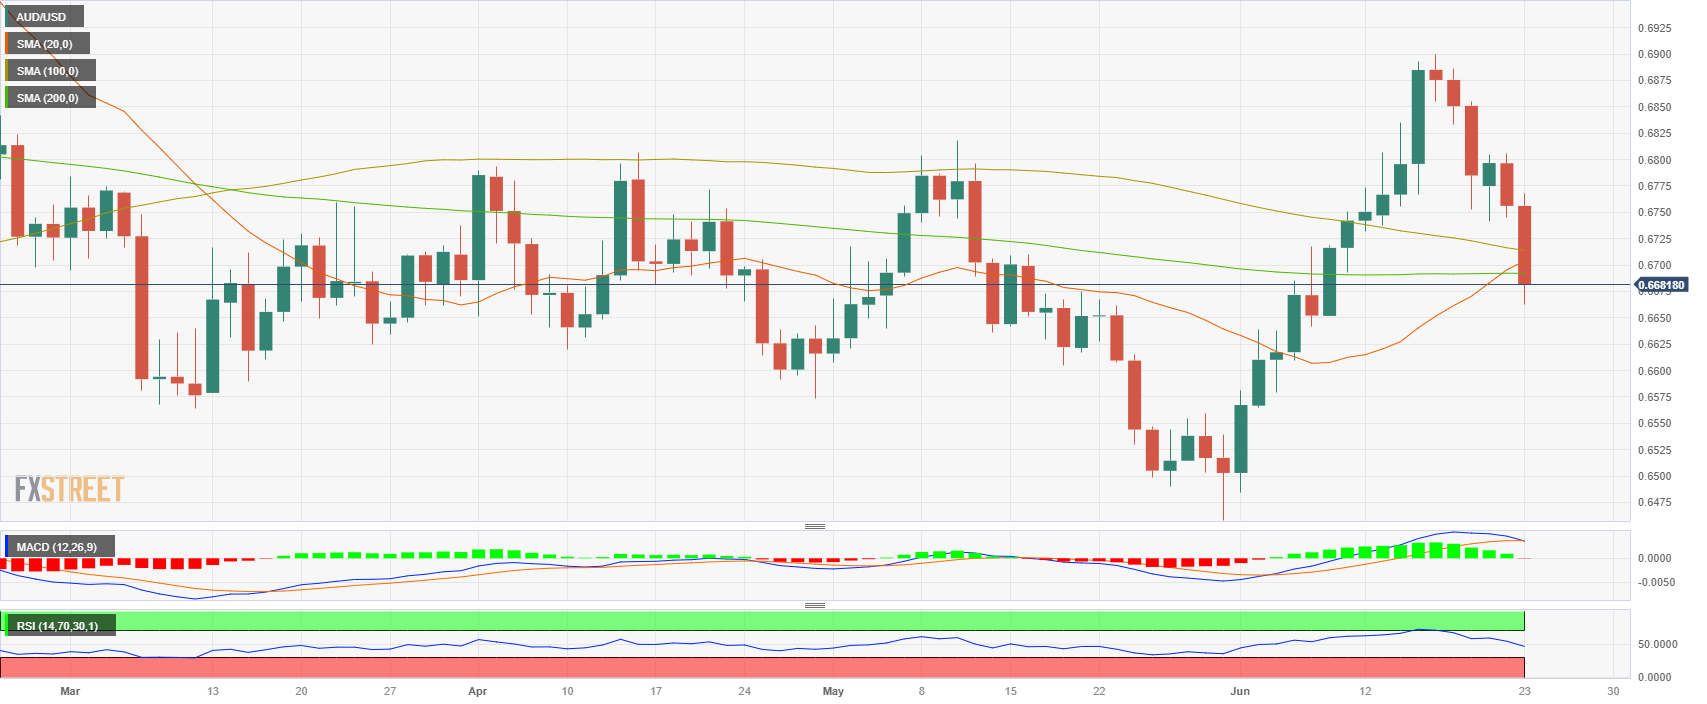
The AUD/USD holds a bearish outlook for the short term, as per the daily chart. The Relative Strength Index (RSI) and Moving Average Convergence Divergence (MACD) both fell to negative territory, and below the 20,100 and 200-day Simple Moving Averages (SMAs). The negative outlook is also seen in the weekly chart where the pair is set to posit the largest weekly decline since March.
In case the AUD/USD loses more ground in the 0.6640 zone, the 0.6620 area and psychological mark at 0.6600 could come into play. On the flip side, the following resistances line up at the 200-day SMA at 0.6690, followed then by the 20-day SMA at 0.670 and the 100-day Simple Moving SMA at 0.6712.
AUD/USD Daily chart


© 2000-2026. Bản quyền Teletrade.
Trang web này được quản lý bởi Teletrade D.J. LLC 2351 LLC 2022 (Euro House, Richmond Hill Road, Kingstown, VC0100, St. Vincent and the Grenadines).
Thông tin trên trang web không phải là cơ sở để đưa ra quyết định đầu tư và chỉ được cung cấp cho mục đích làm quen.
Giao dịch trên thị trường tài chính (đặc biệt là giao dịch sử dụng các công cụ biên) mở ra những cơ hội lớn và tạo điều kiện cho các nhà đầu tư sẵn sàng mạo hiểm để thu lợi nhuận, tuy nhiên nó mang trong mình nguy cơ rủi ro khá cao. Chính vì vậy trước khi tiến hành giao dịch cần phải xem xét mọi mặt vấn đề chấp nhận tiến hành giao dịch cụ thể xét theo quan điểm của nguồn lực tài chính sẵn có và mức độ am hiểu thị trường tài chính.
Sử dụng thông tin: sử dụng toàn bộ hay riêng biệt các dữ liệu trên trang web của công ty TeleTrade như một nguồn cung cấp thông tin nhất định. Việc sử dụng tư liệu từ trang web cần kèm theo liên kết đến trang teletrade.vn. Việc tự động thu thập số liệu cũng như thông tin từ trang web TeleTrade đều không được phép.
Xin vui lòng liên hệ với pr@teletrade.global nếu có câu hỏi.
ngân hàng