- Phân tích
- Tin tức và các công cụ
- Tin tức thị trường
- Gold Price Forecast: XAU/USD bulls need acceptance from $1,950 and inflation numbers – Confluence Detector
Gold Price Forecast: XAU/USD bulls need acceptance from $1,950 and inflation numbers – Confluence Detector
- Gold Price extends recovery from 14-week low but bulls struggle to find acceptance of late.
- Mixed concerns about China economic recovery join geopolitical concerns about Russia to prod XAU/USD buyers.
- Inflation clues will be important for Gold traders as multiple central bankers will speak at ECB forum.
- XAU/USD buyers should cross $1,951 resistance confluence to avoid odds favoring pullback to multi-day bottom.
Gold Price (XAU/USD) struggles to defend the corrective bounce off a three-month low marked in the last week, retreating from intraday top of late, amid mixed concerns about Russia and China. Also challenging the XAU/USD buyers is the cautious mood ahead of this week’s top-tier inflation signals from the US and Europe, as well as central bankers’ speeches at the European Central Bank (ECB) Forum and the US Banking Stress Test results.
That said, hopes of more China stimulus defend the Gold Price amid the US Dollar’s retreat as Russia’s short-lived mutiny portrays mildly positive sentiment in the market. However, the S&P’s downward revision of China’s growth forecasts and global fears that the Dragon Nation is off the track of recovery prod the XAU/USD bulls. Further, fears that Russia may take harsh steps to prove its geopolitical strength joins the downbeat concerns about “higher for longer” interest rates to challenge the Gold buyers. It should be noted that the comparatively upbeat US PMIs join the hawkish Fed signals to act as an extra upside filter for the XAU/USD price.
Moving on, mid-tier data may entertain the Gold traders but major attention will be given to inflation clues and geopolitical news for clear directions.
Also read: Gold Price Forecast: XAU/USD recovers on growth and geopolitical fears, $1,943 holds the key
Gold Price: Key levels to watch
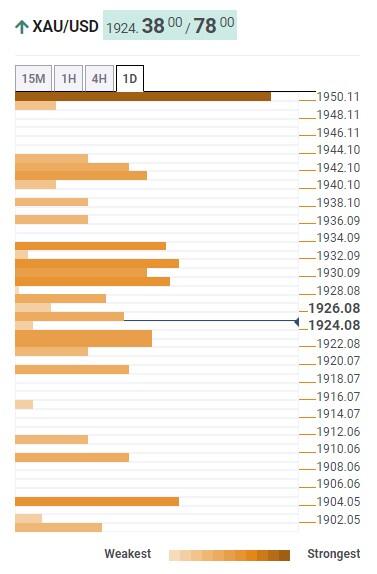
Our Technical Confluence Indicator signals a slow grind in the Gold Price towards the $1,951 key resistance comprising Pivot Point one-week R1, the middle band of the Bollinger on onda-day and Pivot Point one-day R2.
Ahead of that, a convergence of the 5-DMA, Fibonacci 23.6% on one-day and upper band of the Bollinger on the hourly chart will challenge the Gold buyers near $1,933.
It should be noted that the 10-DMA, Fibonacci 61.8% on one-week and 200-HMA, close to $1,943 by the press time, act as an extra upside filter ahead of highlighting the $1,951 hurdle.
Alternatively, Fibonacci 23.6% on one-week highlights $1,922 as immediate support for the Gold sellers to watch during the quote’s fresh fall.
Following that, the lower band of the Bollinger on the one-day, near $1,918, will precede the Pivot Point one-day S1, close to $1,908, to challenge the Gold bears.
Above all, the Gold sellers remain confused unless the quote stays beyond the $1,904 support encompassing the Pivot Point one-month S1.
Here is how it looks on the tool
About Technical Confluences Detector
The TCD (Technical Confluences Detector) is a tool to locate and point out those price levels where there is a congestion of indicators, moving averages, Fibonacci levels, Pivot Points, etc. If you are a short-term trader, you will find entry points for counter-trend strategies and hunt a few points at a time. If you are a medium-to-long-term trader, this tool will allow you to know in advance the price levels where a medium-to-long-term trend may stop and rest, where to unwind positions, or where to increase your position size.


© 2000-2026. Bản quyền Teletrade.
Trang web này được quản lý bởi Teletrade D.J. LLC 2351 LLC 2022 (Euro House, Richmond Hill Road, Kingstown, VC0100, St. Vincent and the Grenadines).
Thông tin trên trang web không phải là cơ sở để đưa ra quyết định đầu tư và chỉ được cung cấp cho mục đích làm quen.
Giao dịch trên thị trường tài chính (đặc biệt là giao dịch sử dụng các công cụ biên) mở ra những cơ hội lớn và tạo điều kiện cho các nhà đầu tư sẵn sàng mạo hiểm để thu lợi nhuận, tuy nhiên nó mang trong mình nguy cơ rủi ro khá cao. Chính vì vậy trước khi tiến hành giao dịch cần phải xem xét mọi mặt vấn đề chấp nhận tiến hành giao dịch cụ thể xét theo quan điểm của nguồn lực tài chính sẵn có và mức độ am hiểu thị trường tài chính.
Sử dụng thông tin: sử dụng toàn bộ hay riêng biệt các dữ liệu trên trang web của công ty TeleTrade như một nguồn cung cấp thông tin nhất định. Việc sử dụng tư liệu từ trang web cần kèm theo liên kết đến trang teletrade.vn. Việc tự động thu thập số liệu cũng như thông tin từ trang web TeleTrade đều không được phép.
Xin vui lòng liên hệ với pr@teletrade.global nếu có câu hỏi.
ngân hàng