- Phân tích
- Tin tức và các công cụ
- Tin tức thị trường
- Gold Price Forecast: XAU/USD bulls seem cautious within $1,925-30 range as US data looms – Confluence Detector
Gold Price Forecast: XAU/USD bulls seem cautious within $1,925-30 range as US data looms – Confluence Detector
- Gold Price remains on the front foot for the third consecutive day.
- XAU/USD bulls attack short-term key hurdle amid softer US Dollar, risk-on mood.
- China manages to propel sentiment and weigh on US Dollar ahead of mid-tier data.
- Upbeat US statistics, hawkish Fedspeak needed to stop the Gold buyers.
Gold Price (XAU/USD) clings to mild gains around the intraday high as it prints a three-day winning streak amid cautiously optimistic markets. In doing so, the precious metal cheers the US Dollar’s positioning for the key data, as well as the risk-positive headlines from China, amid dicey trading hours on Tuesday.
People’s Bank of China’s (PBoC) lower-than-expected fixing of the USD/CNY price joined the alleged selling of the US Dollar by the Chinese state banks in the offshore currency markets to weigh on the USD and propel the Gold Price. Additionally, news the Asian lobbyists are advocating for easies rules for Chinese equities’ listing and headlines suggesting an end to fears surrounding Moscow’s mutiny allow the traders to remain optimistic and favor the Gold Price.
However, Monday’s US activity numbers and hawkish comments from the Fed officials, as well as the last week’s upbeat testimony from Fed Chair Jerome Powell, challenge the Gold buyers. Hence, US Durable Goods Orders for May, expected -1.0% versus 1.1% prior, as well as the US Conference Board’s (CB) Consumer Confidence for June, expected to arrive at 103.90 versus 102.30 prior, will be in the spotlight for intraday directions of the Gold price.
Also read: Gold Price Forecast: XAU/USD buyers needs validation from key resistance near $1,940
Gold Price: Key levels to watch
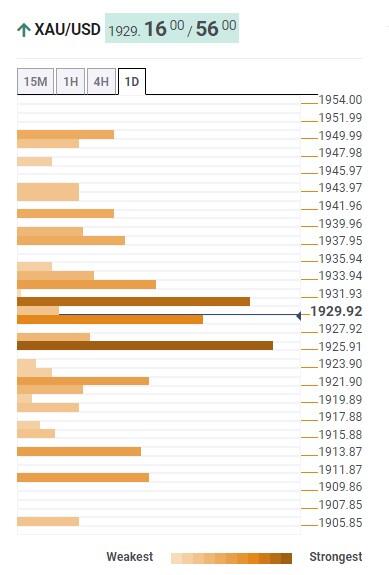
As per our Technical Confluence Indicator, the Gold Price remains tight-lipped within a short-term trading range even if the bulls occupy the driver’s seat of late.
That said, a convergence of the 5-DMA and Fibonacci 61.8% on one-day puts a floor under the XAU/USD price around $1,925 while Pivot Point one-day R2 and Fibonacci 23.6% on one-day caps the bullion’s immediate upside.
It’s worth noting that the previous monthly low of around $1,932 acts as an extra upside filter to watch for the Gold buyers before challenging the key $1,942 hurdle encompassing the Fibonacci 61.8% in one week. Furthermore, Pivot Point one-week R1 acts as the final defense of the XAU/USD bears around $1,950.
On the flip side, the Gold Price weakness past $1,925 could poke the joint of the Fibonacci 23.6% in one week and the middle band of the Bollinger in four-hour, around $1,921.
In a case where the XAU/USD remains bearish past $1,921, Fibonacci 161.8% on one-day joins Pivot Point one-day S2 and the lower band of the Bollinger on four-hour to offer the final fight to the Gold buyers near $1,910.
Here is how it looks on the tool
About Technical Confluences Detector
The TCD (Technical Confluences Detector) is a tool to locate and point out those price levels where there is a congestion of indicators, moving averages, Fibonacci levels, Pivot Points, etc. If you are a short-term trader, you will find entry points for counter-trend strategies and hunt a few points at a time. If you are a medium-to-long-term trader, this tool will allow you to know in advance the price levels where a medium-to-long-term trend may stop and rest, where to unwind positions, or where to increase your position size.


© 2000-2026. Bản quyền Teletrade.
Trang web này được quản lý bởi Teletrade D.J. LLC 2351 LLC 2022 (Euro House, Richmond Hill Road, Kingstown, VC0100, St. Vincent and the Grenadines).
Thông tin trên trang web không phải là cơ sở để đưa ra quyết định đầu tư và chỉ được cung cấp cho mục đích làm quen.
Giao dịch trên thị trường tài chính (đặc biệt là giao dịch sử dụng các công cụ biên) mở ra những cơ hội lớn và tạo điều kiện cho các nhà đầu tư sẵn sàng mạo hiểm để thu lợi nhuận, tuy nhiên nó mang trong mình nguy cơ rủi ro khá cao. Chính vì vậy trước khi tiến hành giao dịch cần phải xem xét mọi mặt vấn đề chấp nhận tiến hành giao dịch cụ thể xét theo quan điểm của nguồn lực tài chính sẵn có và mức độ am hiểu thị trường tài chính.
Sử dụng thông tin: sử dụng toàn bộ hay riêng biệt các dữ liệu trên trang web của công ty TeleTrade như một nguồn cung cấp thông tin nhất định. Việc sử dụng tư liệu từ trang web cần kèm theo liên kết đến trang teletrade.vn. Việc tự động thu thập số liệu cũng như thông tin từ trang web TeleTrade đều không được phép.
Xin vui lòng liên hệ với pr@teletrade.global nếu có câu hỏi.
ngân hàng