- Phân tích
- Tin tức và các công cụ
- Tin tức thị trường
- Gold Price Forecast: XAU/USD prepares for a rally above $1,930 as USD Index drops ahead of US Durables
Gold Price Forecast: XAU/USD prepares for a rally above $1,930 as USD Index drops ahead of US Durables
- Gold price is anticipating a range expansion amid a further decline in the US Dollar Index.
- Mixed responses from Fed policymakers have kept investors on their toes.
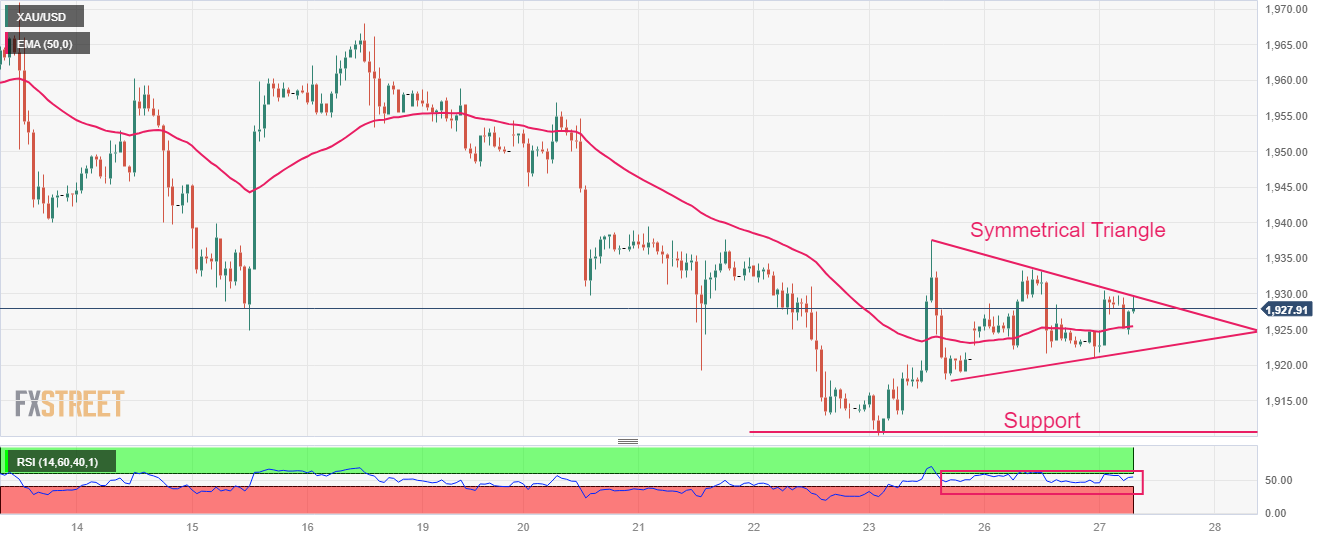
- Gold price is auctioning in a Symmetrical Triangle chart pattern, which indicates a decline in volatility.
Gold price (XAU/USD) is demonstrating signs of volatility contraction below $1,930.00 in the European session. The precious metal is looking to deliver gains as the US Dollar Index (DXY) has come under pressure due to the risk-appetite theme.
S&P500 futures have posted decent gains in London as investors are shrugging-off uncertainty associated with the upcoming quarterly result season. The USD Index has refreshed its day’s low at 102.49 amid positive market sentiment. Meanwhile, upbeat US Yields have been restricting the upside in the Gold price. The 10-year US Treasury yields have jumped to near 3.74%.
Mixed responses from Federal Reserve (Fed) policymakers have kept investors on their toes. Atlanta Fed Bank President Raphael Bostic favored the continuation of a steady policy as further restrictions could damage the strength of the economy. On the contrary, San Francisco Fed Bank President Mary Daly suggested that two more rate hikes this year are a “very reasonable” projection, supporting similar commentary from Fed chair Jerome Powell.
For further actions, the United States Durable Goods Orders data will be in focus. As per the consensus, the economic data is seen contracting by 1.0% vs. an expansion of 1.1%. Durable Goods Orders excluding defense are seen as stagnant against a contraction of 0.7%.
Gold technical analysis
Gold price is auctioning in a Symmetrical Triangle chart pattern on an hourly scale, which indicates a decline in volatility but is followed by an explosion in the same. Horizontal support is plotted from the previous week’s low at $1,910.18.
A straight 50-period Exponential Moving Average (EMA) at $1,926.00 portrays a non-directional performance.
The Relative Strength Index (RSI) (14) is oscillating in the 40.00-60.00 range, which indicates that investors await a potential trigger.
Gold hourly chart


© 2000-2026. Bản quyền Teletrade.
Trang web này được quản lý bởi Teletrade D.J. LLC 2351 LLC 2022 (Euro House, Richmond Hill Road, Kingstown, VC0100, St. Vincent and the Grenadines).
Thông tin trên trang web không phải là cơ sở để đưa ra quyết định đầu tư và chỉ được cung cấp cho mục đích làm quen.
Giao dịch trên thị trường tài chính (đặc biệt là giao dịch sử dụng các công cụ biên) mở ra những cơ hội lớn và tạo điều kiện cho các nhà đầu tư sẵn sàng mạo hiểm để thu lợi nhuận, tuy nhiên nó mang trong mình nguy cơ rủi ro khá cao. Chính vì vậy trước khi tiến hành giao dịch cần phải xem xét mọi mặt vấn đề chấp nhận tiến hành giao dịch cụ thể xét theo quan điểm của nguồn lực tài chính sẵn có và mức độ am hiểu thị trường tài chính.
Sử dụng thông tin: sử dụng toàn bộ hay riêng biệt các dữ liệu trên trang web của công ty TeleTrade như một nguồn cung cấp thông tin nhất định. Việc sử dụng tư liệu từ trang web cần kèm theo liên kết đến trang teletrade.vn. Việc tự động thu thập số liệu cũng như thông tin từ trang web TeleTrade đều không được phép.
Xin vui lòng liên hệ với pr@teletrade.global nếu có câu hỏi.
ngân hàng