- Phân tích
- Tin tức và các công cụ
- Tin tức thị trường
- AUD/USD Price Analysis: Bounces off multi-week low, shows resilience below 61.8% Fibo.
AUD/USD Price Analysis: Bounces off multi-week low, shows resilience below 61.8% Fibo.
- AUD/USD drops to a fresh multi-week low in reaction to the softer Australian CPI print.
- The technical setup favours bearish traders and supports prospects for additional losses.
- Some follow-through selling below the 0.6620-15 area will reaffirm the negative outlook.
The AUD/USD pair comes under intense selling pressure during the Asian session on Tuesday and dives to over a three-week low, around the 0.6620-0.6615 region. Spot prices, however, manage to trim a part of heavy intraday losses and currently trade just below mid-0.6600s, still down 0.65% for the day.
The Australian Dollar (AUD) weakens across the board in reaction to the softer domestic data, which showed that the headline CPI decelerated sharply to the 5.6% YoY rate in May from the 6.8% seen in the previous month. This, in turn, lifts the possibility that the Reserve Bank of Australia (RBA) may soon cease its rate hike cycle. Apart from this, the emergence of some US Dollar (USD) buying exerts additional downward pressure on the AUD/USD pair and contributes to the downfall.
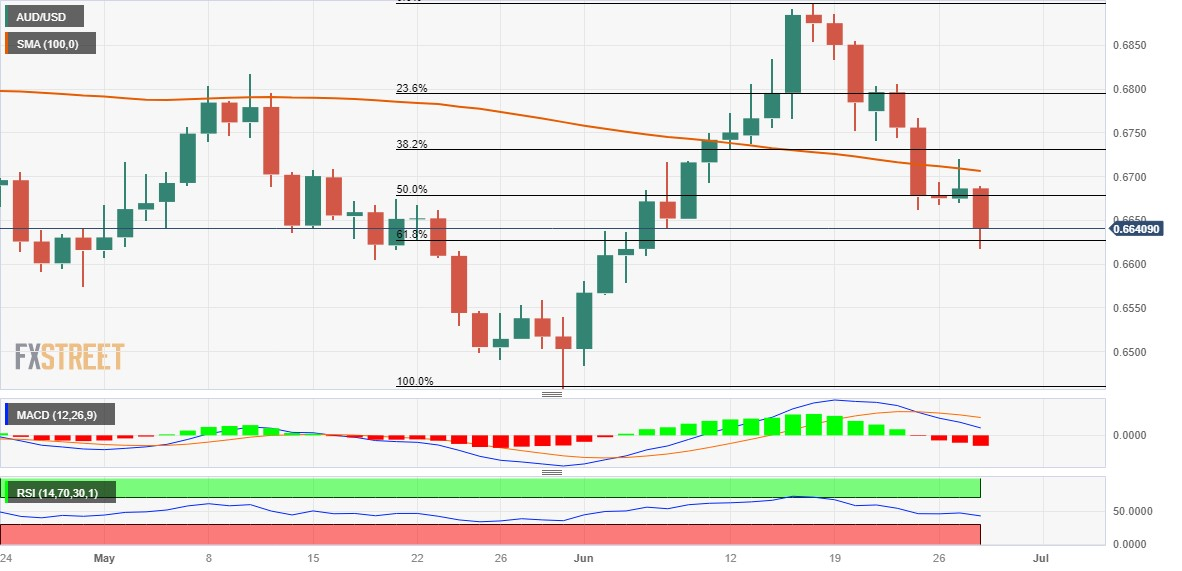
Spot prices, however, show some resilience below the 61.8% Fibonacci retracement level of the May-June rally as traders now move to the sidelines ahead of Federal Reserve (Fed) Chair Jerome Powell's appearance. Meanwhile, technical indicators on the daily chart have just started drifting into the negative territory and support prospects for further losses. Moreover, a sustained break and acceptance below the 0.6675 region, representing 50% Fibo. level, favours bearish traders.
The aforementioned support breakpoint should now act as an immediate hurdle for the AUD/USD pair ahead of the 0.6700 round figure, which coincides with the 100-day Simple Moving Average (SMA). Any subsequent move up is more likely to attract fresh sellers and remain capped near the 38.2% Fibo. level, around the 0.6730 region. The latter should act as a pivotal point, which if cleared will suggest that the recent sharp rejection slide from the 0.6900 mark has run its course.
On the flip side, bearish traders might now wait for some follow-through selling below the 0.6620-0.6615 area, or the daily swing low, before placing fresh bets. The AUD/USD pair might then accelerate the fall towards testing the next relevant support near the 0.6545 region. The downward trajectory could further get extended towards the 0.6500 psychological mark en route to the YTD low, around the 0.6460-0.6455 region touched in May.
AUD/USD daily chart
Key levels to watch


© 2000-2026. Bản quyền Teletrade.
Trang web này được quản lý bởi Teletrade D.J. LLC 2351 LLC 2022 (Euro House, Richmond Hill Road, Kingstown, VC0100, St. Vincent and the Grenadines).
Thông tin trên trang web không phải là cơ sở để đưa ra quyết định đầu tư và chỉ được cung cấp cho mục đích làm quen.
Giao dịch trên thị trường tài chính (đặc biệt là giao dịch sử dụng các công cụ biên) mở ra những cơ hội lớn và tạo điều kiện cho các nhà đầu tư sẵn sàng mạo hiểm để thu lợi nhuận, tuy nhiên nó mang trong mình nguy cơ rủi ro khá cao. Chính vì vậy trước khi tiến hành giao dịch cần phải xem xét mọi mặt vấn đề chấp nhận tiến hành giao dịch cụ thể xét theo quan điểm của nguồn lực tài chính sẵn có và mức độ am hiểu thị trường tài chính.
Sử dụng thông tin: sử dụng toàn bộ hay riêng biệt các dữ liệu trên trang web của công ty TeleTrade như một nguồn cung cấp thông tin nhất định. Việc sử dụng tư liệu từ trang web cần kèm theo liên kết đến trang teletrade.vn. Việc tự động thu thập số liệu cũng như thông tin từ trang web TeleTrade đều không được phép.
Xin vui lòng liên hệ với pr@teletrade.global nếu có câu hỏi.
ngân hàng