- Phân tích
- Tin tức và các công cụ
- Tin tức thị trường
- Gold Price Forecast: XAU/USD loses momentum above $1,915 as Fed Minutes loom – Confluence Detector
Gold Price Forecast: XAU/USD loses momentum above $1,915 as Fed Minutes loom – Confluence Detector
- Gold Price stays defensive after four-day winning streak.
- XAU/USD bears seek entry as US-China trade war appears imminent, recession bell rings.
- FOMC Minutes will be crucial for Gold Price downside as $1,915 provides headwind to bears.
Gold Price (XAU/USD) struggles to extend recovery from a multi-month low marked the last week as traders await the Federal Open Market Committee (FOMC) Minutes for the June meeting. Apart from the pre-event anxiety, the fears of a full-fledged trade war between the US and China join the concerns about the global economic slowdown to prod the XAU/USD price.
Alternatively, softer US data and expectations that the Gold demand from India and China will increase over time put a floor under the Gold Price. However, the metal sellers need to confirm Fed Chairman Jerome Powell’s hawkish statements like, “two more rate hikes in 2023”, to retake control. In doing so, they also need to smash the $1,915 key support.
It should be observed that the US markets were closed the previous day and hence a lack of major catalysts, as well as waiting for the full markets, also restrict the XAU/USD moves.
Also read: Gold Price Forecast: Will Fed Minutes help validate bullish wedge for XAU/USD?
Gold Price: Key levels to watch
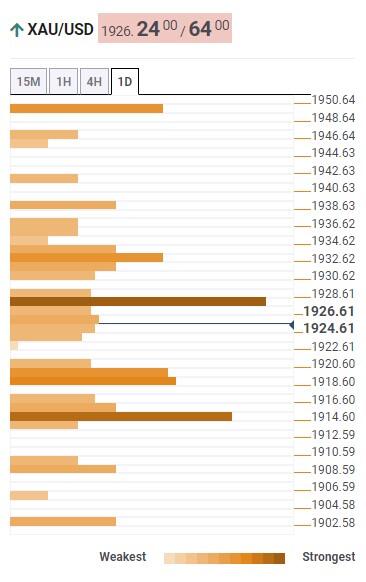
Our Technical Confluence Indicator signals that the Gold Price jostles with a short-term key resistance surrounding $1,930, including Fibonacci 23.6% on one-day and 38.2% on one-month, as well as the previous high on four-hour.
Following that, the previous weekly high of around $1,934 may prod the XAU/USD bulls before directing them to the Fibonacci 61.8% on one-month, also known as the golden Fibonacci ratio, surrounding $1,950.
It’s worth noting that the Gold Price upside past $1,950 appears too lucrative for the bulls and can easily prod the previous monthly high of $1,983.
On the contrary, the 10-DMA joins the Pivot Point one-day S1 to restrict immediate downside of the Gold Price near $1,918.
A break of $1,918, however, will need validation from the $1,915 support confluence comprising the Pivot Point one-day S2 and Fibonacci 23.6% on one-month.
If at all the Gold Price remains weak past $1,915 key support, the odds of witnessing the XAU/USD slump toward $1,900 threshold can’t be ruled out.
Here is how it looks on the tool
About Technical Confluences Detector
The TCD (Technical Confluences Detector) is a tool to locate and point out those price levels where there is a congestion of indicators, moving averages, Fibonacci levels, Pivot Points, etc. If you are a short-term trader, you will find entry points for counter-trend strategies and hunt a few points at a time. If you are a medium-to-long-term trader, this tool will allow you to know in advance the price levels where a medium-to-long-term trend may stop and rest, where to unwind positions, or where to increase your position size.


© 2000-2026. Bản quyền Teletrade.
Trang web này được quản lý bởi Teletrade D.J. LLC 2351 LLC 2022 (Euro House, Richmond Hill Road, Kingstown, VC0100, St. Vincent and the Grenadines).
Thông tin trên trang web không phải là cơ sở để đưa ra quyết định đầu tư và chỉ được cung cấp cho mục đích làm quen.
Giao dịch trên thị trường tài chính (đặc biệt là giao dịch sử dụng các công cụ biên) mở ra những cơ hội lớn và tạo điều kiện cho các nhà đầu tư sẵn sàng mạo hiểm để thu lợi nhuận, tuy nhiên nó mang trong mình nguy cơ rủi ro khá cao. Chính vì vậy trước khi tiến hành giao dịch cần phải xem xét mọi mặt vấn đề chấp nhận tiến hành giao dịch cụ thể xét theo quan điểm của nguồn lực tài chính sẵn có và mức độ am hiểu thị trường tài chính.
Sử dụng thông tin: sử dụng toàn bộ hay riêng biệt các dữ liệu trên trang web của công ty TeleTrade như một nguồn cung cấp thông tin nhất định. Việc sử dụng tư liệu từ trang web cần kèm theo liên kết đến trang teletrade.vn. Việc tự động thu thập số liệu cũng như thông tin từ trang web TeleTrade đều không được phép.
Xin vui lòng liên hệ với pr@teletrade.global nếu có câu hỏi.
ngân hàng