- Phân tích
- Tin tức và các công cụ
- Tin tức thị trường
- Gold Price Forecast: XAU/USD run-up appears more compulsive as US data looms – Confluence Detector
Gold Price Forecast: XAU/USD run-up appears more compulsive as US data looms – Confluence Detector
- Gold Price reverses the previous day’s U-turn from two-week high, eyes the first weekly gain in four.
- Fears of higher rates, Sino-American tension and China economic woes prod XAU/USD bulls.
- Softer US data fails to justify hawkish Fed bets, suggesting proximity to policy pivot and favor Gold buyers in turn.
- $20.00 trading range restricts immediate XAU/USD moves but doubts about US puts a floor under the Gold Price.
Gold Price (XAU/USD) remains on the front foot as markets brace for early signals of the US employment, inflation and activity conditions amid the risk-off mood. It’s worth noting, however, that the US Dollar’s struggle to justify the sour sentiment, maybe due to Wednesday’s softer US data, seems to underpin the Gold Price upside, enabling it to challenge the three-week downturn.
That said, fears of economic slowdown join the major central banks’ push for higher rates, despite softer data, to spoil the risk appetite and fuel the XAU/USD of late, due to the market’s traditional haven status. However, fears about China’s economic recovery and heavy outflow of funds from Beijing to neighboring countries prod the Gold buyers. On the same line could be the recently escalated US-China trade war, as well as geopolitical woes surrounding Russia, Ukraine and Iran.
While portraying the mood, the US stock futures drop for the third consecutive day and the Asian equities are down too. More importantly, the US 10-year and two-year Treasury bond yields jumped to a fresh three-month high before retreating in the last hour.
Looking ahead, today’s US ISM Services PMI and ADP Employment Change for June, as well as China headlines and recession woes, will be crucial for the Gold Price directions.
Also read: Gold Price Forecast: XAU/USD needs a sustained move above $1,918 to unleash the upside
Gold Price: Key levels to watch
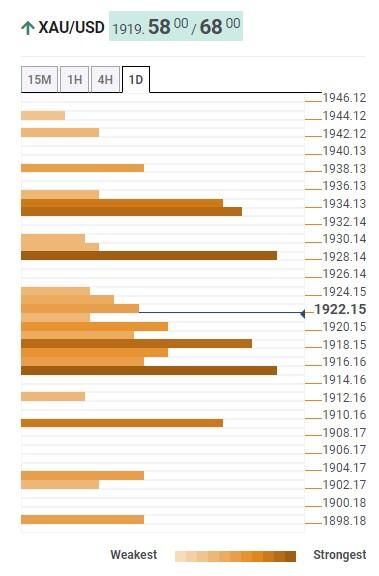
Our Technical Confluence Indicator shows that the Gold Price edges higher within a $20.00 trading range, between $1,916 and $1,936, as markets brace for the top-tier US data.
That said, a convergence of the Fibonacci 23.6% on one-month joins the previous daily low to highlight the short-term key support around $1,916.
Alternatively, the previous daily and weekly high, as well as the middle band of the Bollinger on the daily chart, highlights the $1,936 as the short-term key upside hurdle for the XAU/USD.
That said, Fibonacci 61.8% on one-day and 38.2% on one-month joins Pivot Point one-day R1 to signal the $1,928-29 as nearby upside hurdle.
Meanwhile, 5-DMA and Fibonacci 61.8% on one-week marks the $1,918 as the nearby support for the Gold sellers to watch during the metal’s fresh fall.
It should be noted that a convergence of the Fibonacci 38.2% on one-week and Pivot Point one-day S1 acts as the final defense of the Gold buyers near $1,908 while Pivot Point one-week R1 pin-points $1,940 as an extra filter towards the north.
Here is how it looks on the tool
About Technical Confluences Detector
The TCD (Technical Confluences Detector) is a tool to locate and point out those price levels where there is a congestion of indicators, moving averages, Fibonacci levels, Pivot Points, etc. If you are a short-term trader, you will find entry points for counter-trend strategies and hunt a few points at a time. If you are a medium-to-long-term trader, this tool will allow you to know in advance the price levels where a medium-to-long-term trend may stop and rest, where to unwind positions, or where to increase your position size.


© 2000-2026. Bản quyền Teletrade.
Trang web này được quản lý bởi Teletrade D.J. LLC 2351 LLC 2022 (Euro House, Richmond Hill Road, Kingstown, VC0100, St. Vincent and the Grenadines).
Thông tin trên trang web không phải là cơ sở để đưa ra quyết định đầu tư và chỉ được cung cấp cho mục đích làm quen.
Giao dịch trên thị trường tài chính (đặc biệt là giao dịch sử dụng các công cụ biên) mở ra những cơ hội lớn và tạo điều kiện cho các nhà đầu tư sẵn sàng mạo hiểm để thu lợi nhuận, tuy nhiên nó mang trong mình nguy cơ rủi ro khá cao. Chính vì vậy trước khi tiến hành giao dịch cần phải xem xét mọi mặt vấn đề chấp nhận tiến hành giao dịch cụ thể xét theo quan điểm của nguồn lực tài chính sẵn có và mức độ am hiểu thị trường tài chính.
Sử dụng thông tin: sử dụng toàn bộ hay riêng biệt các dữ liệu trên trang web của công ty TeleTrade như một nguồn cung cấp thông tin nhất định. Việc sử dụng tư liệu từ trang web cần kèm theo liên kết đến trang teletrade.vn. Việc tự động thu thập số liệu cũng như thông tin từ trang web TeleTrade đều không được phép.
Xin vui lòng liên hệ với pr@teletrade.global nếu có câu hỏi.
ngân hàng