- Phân tích
- Tin tức và các công cụ
- Tin tức thị trường
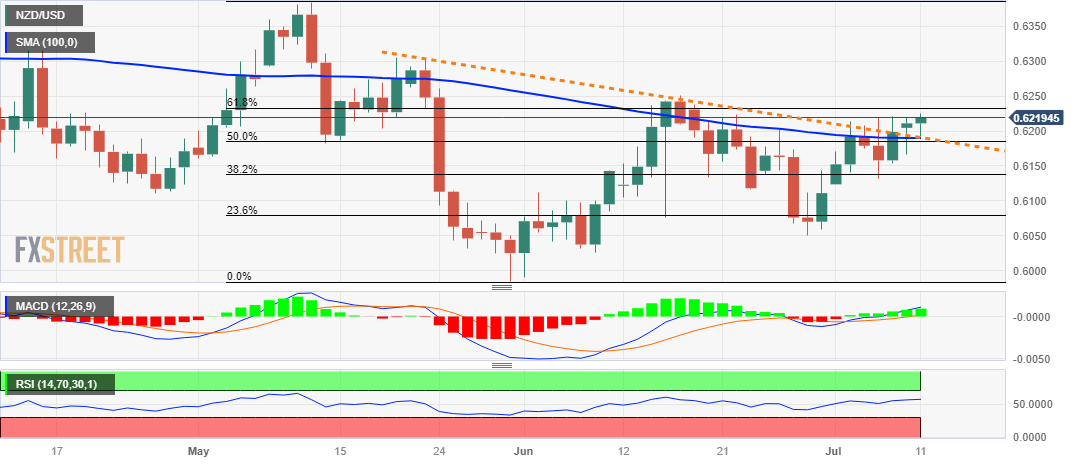
- NZD/USD Price Analysis: Sits near multi-week top, bulls await a move beyond 61.8% Fibo.
NZD/USD Price Analysis: Sits near multi-week top, bulls await a move beyond 61.8% Fibo.
- NZD/USD holds steady near a multi-week high on Tuesday amid a weaker USD.
- The technical setup favours bullish traders and supports prospects for further gains.
- A convincing break below the 0.6100 mark is needed to negate the positive outlook.
The NZD/USD pair edges higher for the third successive day on Tuesday and trades around the 0.6215-0.6220 barrier or a nearly three-week high during the Asian session.
Expectations that the Federal Reserve (Fed) might be nearing the end of its rate hiking cycle keep the US Dollar (USD) bulls on the defensive, which, in turn, acts as a tailwind for the NZD/USD pair. Market participants, however, seem reluctant to place aggressive bets ahead of the key central bank event risk - the Reserve Bank of New Zealand (RBNZ) policy meeting - and the release of the key US CPI report on Wednesday.
From a technical perspective, the recent breakout through a confluence resistance comprising the 100-day Simple Moving Average (SMA) and a descending trend-line suggests that the path of least resistance for the NZD/USD pair is to the upside. Adding to this, oscillators on the daily chart have just started gaining positive traction and validate the constructive setup, supporting prospects for further near-term gains.
That said, it will still be prudent to wait for some follow-through buying beyond the June monthly peak, around the 0.6245-0.6250 region, which coincides with the 61.8% Fibonacci retracement level of the May-June downfall, before placing fresh bullish bets. The NZD/USD pair might then accelerate the momentum towards testing the 0.6285 intermediate hurdle before aiming to reclaim the 0.6300 round-figure mark.
On the flip side, the 0.6190-0.6185 confluence resistance breakpoint now seems to protect the immediate downside ahead of the 38.2% Fibo. level, around the 0.6140-0.6135 region. Any subsequent decline could attract some buying and remain cushioned near the 0.6100 mark. This is closely followed by 23.6% Fibo. level, around the 0.6080 region, below which the NZD/USD pair could slide to the 0.6000 psychological mark.
Some follow-through selling below the YTD low, around the 0.5985 zone touched in June, should pave the way for a further near-term depreciating move.
NZD/USD daily chart
Key levels to watch


© 2000-2026. Bản quyền Teletrade.
Trang web này được quản lý bởi Teletrade D.J. LLC 2351 LLC 2022 (Euro House, Richmond Hill Road, Kingstown, VC0100, St. Vincent and the Grenadines).
Thông tin trên trang web không phải là cơ sở để đưa ra quyết định đầu tư và chỉ được cung cấp cho mục đích làm quen.
Giao dịch trên thị trường tài chính (đặc biệt là giao dịch sử dụng các công cụ biên) mở ra những cơ hội lớn và tạo điều kiện cho các nhà đầu tư sẵn sàng mạo hiểm để thu lợi nhuận, tuy nhiên nó mang trong mình nguy cơ rủi ro khá cao. Chính vì vậy trước khi tiến hành giao dịch cần phải xem xét mọi mặt vấn đề chấp nhận tiến hành giao dịch cụ thể xét theo quan điểm của nguồn lực tài chính sẵn có và mức độ am hiểu thị trường tài chính.
Sử dụng thông tin: sử dụng toàn bộ hay riêng biệt các dữ liệu trên trang web của công ty TeleTrade như một nguồn cung cấp thông tin nhất định. Việc sử dụng tư liệu từ trang web cần kèm theo liên kết đến trang teletrade.vn. Việc tự động thu thập số liệu cũng như thông tin từ trang web TeleTrade đều không được phép.
Xin vui lòng liên hệ với pr@teletrade.global nếu có câu hỏi.
ngân hàng