- Phân tích
- Tin tức và các công cụ
- Tin tức thị trường
- Gold Price Forecast: XAU/USD refreshes three-week high above $1,940 as US CPI sets to soften further
Gold Price Forecast: XAU/USD refreshes three-week high above $1,940 as US CPI sets to soften further
- Gold price has printed a fresh three-week high above $1,940.00 ahead of US inflation and Fed’s Beige Book.
- Investors have sidelined ahead of the second-quarter corporate earnings and inflation data.
- Gold price is on the verge of delivering a breakout of the Inverted Head and Shoulder pattern.
Gold price (XAU/USD) has printed a fresh three-week high at $1,941.60 in the early European session. The precious metal is gathering strength to deliver a confident break above $1,940.00 as the US Dollar Index (DXY) is under extreme pressure due to expectations of further deceleration in the United States Consumer Price Index (CPI) data.
S&P500 futures have turned choppy after a bullish Tuesday, portraying quiet market sentiment for now in the overall upbeat risk profile. Investors have sidelined ahead of the second-quarter corporate earnings and inflation data. The 10-year US Treasury yields have shown a minor decline to near 3.96%.
The USD Index has found intermediate support near 101.35, however, the downside bias is still solid. Economists at Commerzbank cited it would probably be too early though to write off the Dollar at this stage. The labor market report on Friday was not that bad after all. We assume that the labor market remains too tight for the liking of the Federal Reserve (Fed) and that it will therefore hike its key rate once again at the end of July.
Meanwhile, investors are entirely focusing on the inflation data. As per expectations, monthly and core inflation are expected to maintain a steady pace of 0.3%. Annualized figures for headline and core CPI are likely to soften to 3.1% and 5.0% respectively. Apart from the inflation data, investors will also focus on the Fed’s Beige Book.
Gold technical analysis
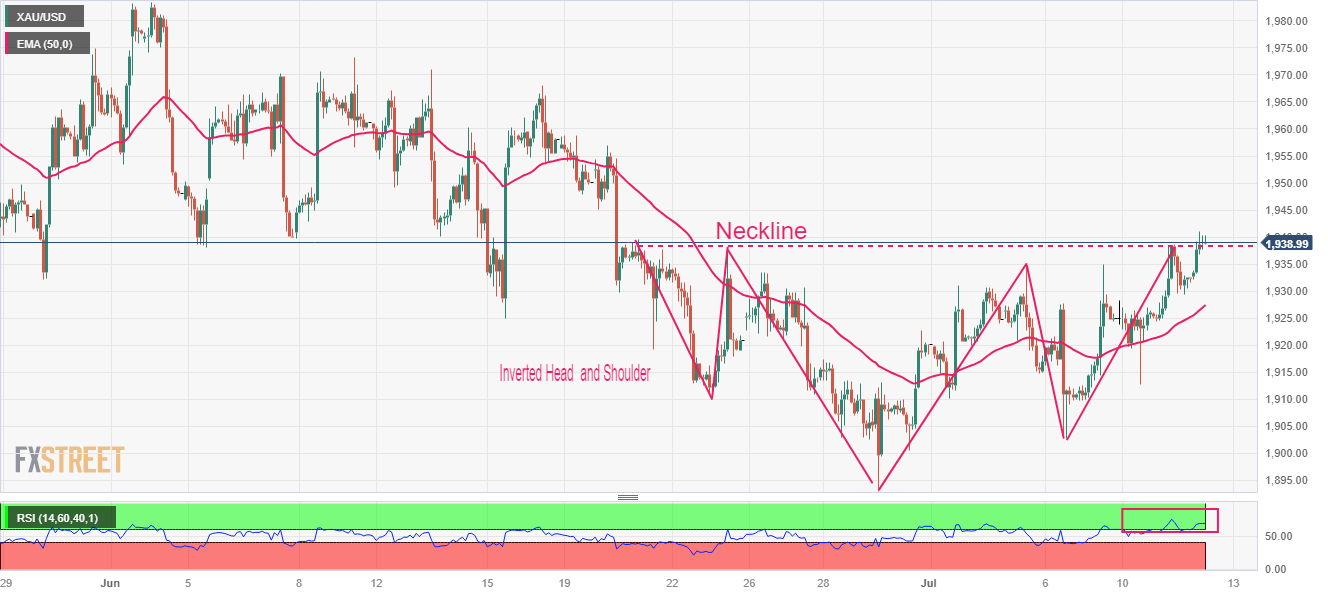
Gold price is on the verge of delivering a breakout of the Inverted Head and Shoulder chart pattern formed on a two-hour scale. A breakout of the aforementioned chart pattern will result in a bullish reversal. The neckline of the chart pattern is plotted around June 21 high at $1,940.00.
The 50-period Exponential Moving Average (EMA) at $1,927.65 is providing a cushion to the Gold bulls.
Meanwhile, the Relative Strength Index (RSI) (14) has confidently shifted into the bullish range of 60.00-80.00, which indicates that the bullish momentum has been triggered.
Gold two-hour chart


© 2000-2026. Bản quyền Teletrade.
Trang web này được quản lý bởi Teletrade D.J. LLC 2351 LLC 2022 (Euro House, Richmond Hill Road, Kingstown, VC0100, St. Vincent and the Grenadines).
Thông tin trên trang web không phải là cơ sở để đưa ra quyết định đầu tư và chỉ được cung cấp cho mục đích làm quen.
Giao dịch trên thị trường tài chính (đặc biệt là giao dịch sử dụng các công cụ biên) mở ra những cơ hội lớn và tạo điều kiện cho các nhà đầu tư sẵn sàng mạo hiểm để thu lợi nhuận, tuy nhiên nó mang trong mình nguy cơ rủi ro khá cao. Chính vì vậy trước khi tiến hành giao dịch cần phải xem xét mọi mặt vấn đề chấp nhận tiến hành giao dịch cụ thể xét theo quan điểm của nguồn lực tài chính sẵn có và mức độ am hiểu thị trường tài chính.
Sử dụng thông tin: sử dụng toàn bộ hay riêng biệt các dữ liệu trên trang web của công ty TeleTrade như một nguồn cung cấp thông tin nhất định. Việc sử dụng tư liệu từ trang web cần kèm theo liên kết đến trang teletrade.vn. Việc tự động thu thập số liệu cũng như thông tin từ trang web TeleTrade đều không được phép.
Xin vui lòng liên hệ với pr@teletrade.global nếu có câu hỏi.
ngân hàng