- Phân tích
- Tin tức và các công cụ
- Tin tức thị trường
- Gold Price Forecast: XAU/USD faces delicate barricades around $1,960, upside remains favored, US PPI eyed
Gold Price Forecast: XAU/USD faces delicate barricades around $1,960, upside remains favored, US PPI eyed
- Gold price is expected to cross the immediate resistance of $1,960.00 as US inflation has decelerated sharply.
- The US Dollar Index has turned sideways around 100.50 after a five-day losing streak.
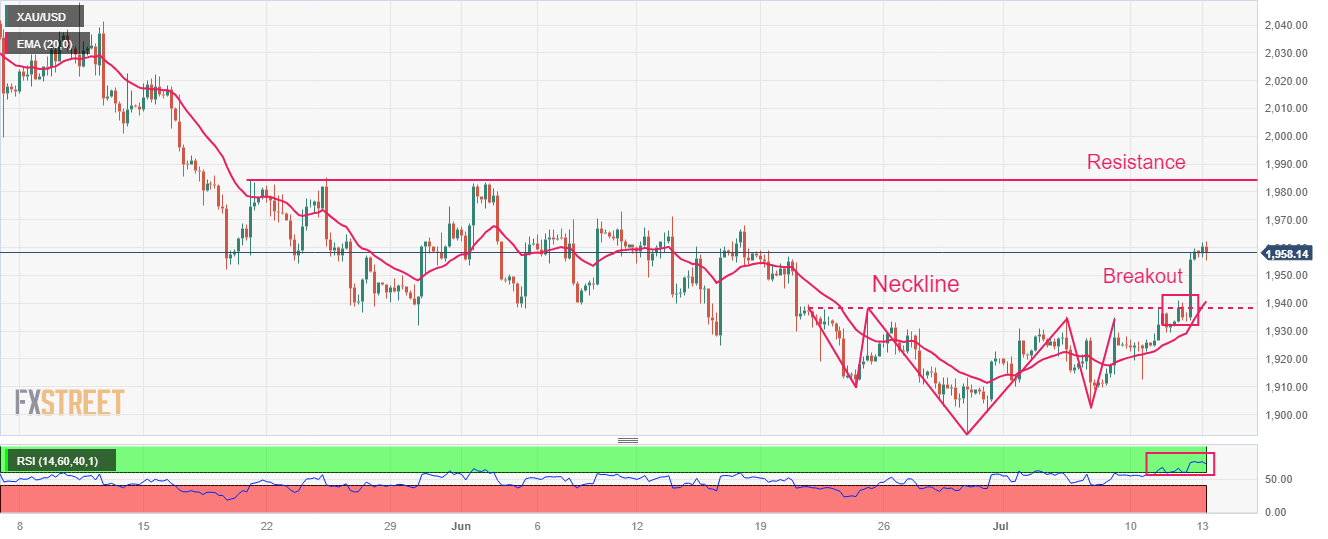
- Gold price has delivered a breakout of the Inverted Head and Shoulder chart pattern.
Gold price (XAU/USD) has faced fragile barricades while attempting to surpass the immediate resistance of $1,960.00 in the late Asian session. The precious metal has is expected to resume its upside journey as inflationary pressures in the United States have softened dramatically and are sufficient to encourage the Federal Reserve (Fed) to go with only one interest rate hike by year-end.
S&P500 futures have posted significant gains overnight. US equities ended on a bullish note on Wednesday, portraying strength in the risk appetite theme. The US-500 stock basket could show some uncertain moves as the second-quarter result season will kick off sooner.
The US Dollar Index (DXY) has turned sideways around 100.50 after a five-day losing streak as the sheer softening of the United States Consumer Price Index (CPI) has trimmed fears of a potential recession. On Thursday, US Producer Price Index (PPI) data will be keenly watched.
About interest rate guidance, economists at Commerzbank cited that in the US, there are increasing signs that inflationary pressure is easing. In June, consumer prices rose by only 0.2% compared with the previous month. The core rate (which excludes energy and food), which is important as a measure of the underlying trend, was also only 0.2%, the smallest increase since February 2021. While the Fed is still likely to raise interest rates again at the end of the month, the data support our view that this should be the last hike.
Gold technical analysis
Gold price has delivered a breakout of the Inverted Head and Shoulder chart pattern formed on a four-hour scale. A breakout of the aforementioned chart pattern has resulted in a bullish reversal. The neckline of the chart pattern was plotted around June 21 high at $1,940.00. The next stop for the Gold bulls is placed around May 19 high at $1,984.25.
The 20-period Exponential Moving Average (EMA) at $1,940.21 will continue to provide a cushion to the Gold bulls.
Meanwhile, the Relative Strength Index (RSI) (14) has confidently shifted into the bullish range of 60.00-80.00, which indicates that the bullish momentum has been triggered.
Gold two-hour chart


© 2000-2026. Bản quyền Teletrade.
Trang web này được quản lý bởi Teletrade D.J. LLC 2351 LLC 2022 (Euro House, Richmond Hill Road, Kingstown, VC0100, St. Vincent and the Grenadines).
Thông tin trên trang web không phải là cơ sở để đưa ra quyết định đầu tư và chỉ được cung cấp cho mục đích làm quen.
Giao dịch trên thị trường tài chính (đặc biệt là giao dịch sử dụng các công cụ biên) mở ra những cơ hội lớn và tạo điều kiện cho các nhà đầu tư sẵn sàng mạo hiểm để thu lợi nhuận, tuy nhiên nó mang trong mình nguy cơ rủi ro khá cao. Chính vì vậy trước khi tiến hành giao dịch cần phải xem xét mọi mặt vấn đề chấp nhận tiến hành giao dịch cụ thể xét theo quan điểm của nguồn lực tài chính sẵn có và mức độ am hiểu thị trường tài chính.
Sử dụng thông tin: sử dụng toàn bộ hay riêng biệt các dữ liệu trên trang web của công ty TeleTrade như một nguồn cung cấp thông tin nhất định. Việc sử dụng tư liệu từ trang web cần kèm theo liên kết đến trang teletrade.vn. Việc tự động thu thập số liệu cũng như thông tin từ trang web TeleTrade đều không được phép.
Xin vui lòng liên hệ với pr@teletrade.global nếu có câu hỏi.
ngân hàng