- Phân tích
- Tin tức và các công cụ
- Tin tức thị trường
- USD/INR Price Analysis: Bears flirt with multi-month-old ascending trend-line support near 82.00
USD/INR Price Analysis: Bears flirt with multi-month-old ascending trend-line support near 82.00
- USD/INR remains confined in a narrow trading band around the 82.00 mark on Tuesday.
- Acceptance below the 200-day SMA supports prospects for some meaningful decline.
- Some follow-through selling below the monthly low will reaffirm the negative outlook.
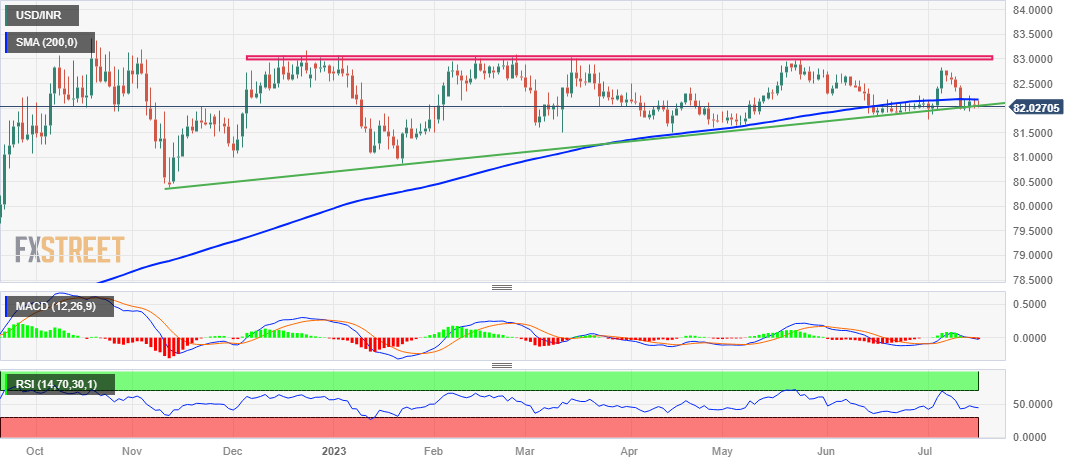
The USD/INR pair edges lower for the second successive day on Tuesday, albeit lacks follow-through selling and remains confined in a familiar multi-day-old trading range. Spot prices currently trade around the 82.00 round figure, with bears now awaiting a sustained breakdown through upward-sloping trend-line support extending from November 2022.
Against the backdrop of the recent repeated failures ahead of the 83.00 mark, acceptance back below a technically significant 200-day Simple Moving Average could be seen as a fresh trigger for bearish traders. Moreover, oscillators on the daily chart have again started drifting in the negative territory and suggest that the path of least resistance for the USD/INR pair is to the downside.
That said, it will still be prudent to wait for some follow-through selling below the monthly low, around the 81.75 region, before traders start positioning for any further depreciating move. The USD/INR pair might then accelerate the slide towards the next relevant support near the 81.50 zone before eventually dropping to test sub-81.00 levels or the YTD low touched in January.
On the flip side, the 82.20 area (200-day SMA) now seems to act as an immediate resistance. A sustained strength beyond will reinforce the ascending trend-line support and the subsequent move up has the potential to lift the USD/INR pair beyond the 82.70-82.75 intermediate hurdle. Bullish traders might then make a fresh attempt to conquer the 83.00 round-figure mark.
The said handle has been acting as a strong barrier since October 2022, which if cleared will mark a fresh bullish breakout and set the stage for an extension of the USD/INR pair's well-established uptrend witnessed since August 2022. Spot prices might then surpass the all-time peak, around the 83.40-83.45 region touched in October 2023, and aim to reclaim the 84.00 mark.
USD/INR daily chart
Key levels to watch


© 2000-2026. Bản quyền Teletrade.
Trang web này được quản lý bởi Teletrade D.J. LLC 2351 LLC 2022 (Euro House, Richmond Hill Road, Kingstown, VC0100, St. Vincent and the Grenadines).
Thông tin trên trang web không phải là cơ sở để đưa ra quyết định đầu tư và chỉ được cung cấp cho mục đích làm quen.
Giao dịch trên thị trường tài chính (đặc biệt là giao dịch sử dụng các công cụ biên) mở ra những cơ hội lớn và tạo điều kiện cho các nhà đầu tư sẵn sàng mạo hiểm để thu lợi nhuận, tuy nhiên nó mang trong mình nguy cơ rủi ro khá cao. Chính vì vậy trước khi tiến hành giao dịch cần phải xem xét mọi mặt vấn đề chấp nhận tiến hành giao dịch cụ thể xét theo quan điểm của nguồn lực tài chính sẵn có và mức độ am hiểu thị trường tài chính.
Sử dụng thông tin: sử dụng toàn bộ hay riêng biệt các dữ liệu trên trang web của công ty TeleTrade như một nguồn cung cấp thông tin nhất định. Việc sử dụng tư liệu từ trang web cần kèm theo liên kết đến trang teletrade.vn. Việc tự động thu thập số liệu cũng như thông tin từ trang web TeleTrade đều không được phép.
Xin vui lòng liên hệ với pr@teletrade.global nếu có câu hỏi.
ngân hàng