- Phân tích
- Tin tức và các công cụ
- Tin tức thị trường
- Silver Price Analysis: XAG/USD holds to gains above @$25.00 as rising-wedge looms
Silver Price Analysis: XAG/USD holds to gains above @$25.00 as rising-wedge looms
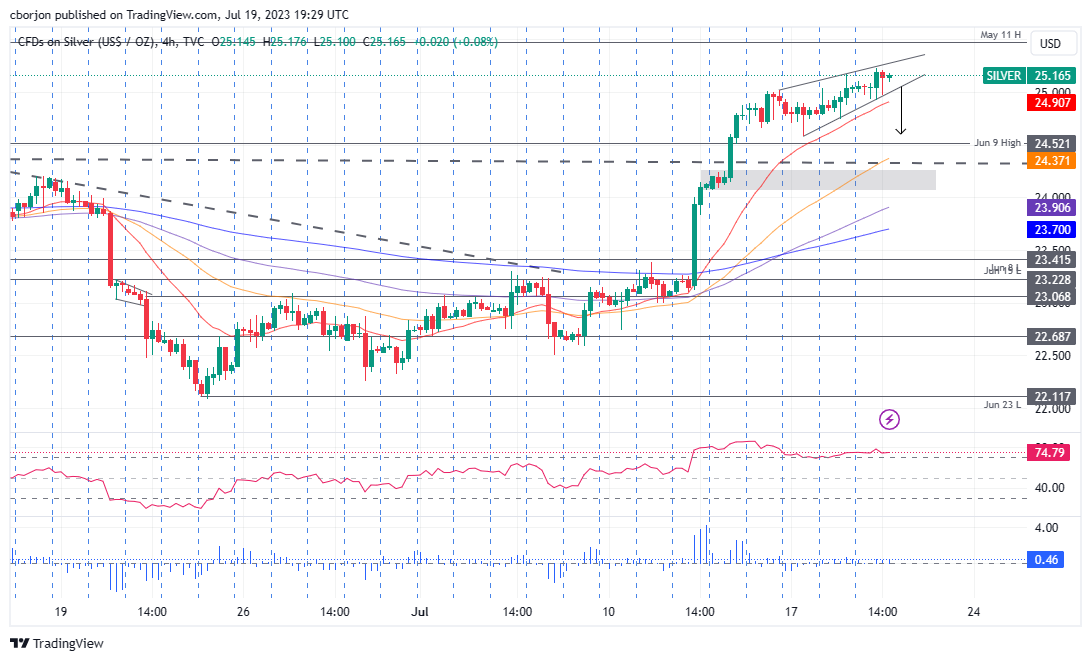
- Four days of steady upward momentum on the daily chart, with XAG/USD consolidating around the $24.50-$25.20 zone.
- The 4-hour chart signals a potential pullback, forming a rising wedge with the 20-EMA offering possible support at around $24.95.
- Resistance lies at the May 11 high of $25.47 and the May 10 high of $25.91. Should XAG/USD fall, support can be found at $25.00, $24.95 (20-EMA), and $24.52 (June 9 high).
Silver price achieves modest gains on Wednesday amid falling US Treasury bond yields despite overall US Dollar (USD) strength across the FX board. Soft US housing data, and yesterday’s mixed Retail Sales figures, boosted the USD. That said, the XAG/USD is trading at $25.14, above its opening price by 0.34%.
XAG/USD Price Analysis: Technical outlook
The XAG/USD daily chart portrays the white metal as upward biased, rising steadily during the last four days after the July 13 rally of almost 3%. Since then, the XAG/USD has remained at around the $24.50-$25.20 area, consolidating ahead of testing strong resistance at the May 11 daily high of $25.47, ahead of the XAG/USD’s reaching the year-to-date (YTD) high of $26.13.
From an intraday perspective, the XAG/USD 4-hour chart portrays the pair as upward biased but forming a rising wedge, which could pave the way for a pullback. Still, the presence of the 20-Exponential Moving Average (EMA) at around $24.95 tracks XAG/USD price action and might cap Silver’s fall, once it breaks out.
The XAG/USD first support would be the $25.00 figure. Once cleared, the next support would be the 20-EMA at $24.95, followed by the June 9 daily high at $24.52. A breakout below that level would expose a strong support area at around $24.00/25.
Conversely, if XAG/USD rallies past the top of the rising wedge, the following supply area would be the May 11 daily high at $25.47, followed by the May 10 high at $25.91.
XAG/USD Price Action – 4-Hour chart


© 2000-2026. Bản quyền Teletrade.
Trang web này được quản lý bởi Teletrade D.J. LLC 2351 LLC 2022 (Euro House, Richmond Hill Road, Kingstown, VC0100, St. Vincent and the Grenadines).
Thông tin trên trang web không phải là cơ sở để đưa ra quyết định đầu tư và chỉ được cung cấp cho mục đích làm quen.
Giao dịch trên thị trường tài chính (đặc biệt là giao dịch sử dụng các công cụ biên) mở ra những cơ hội lớn và tạo điều kiện cho các nhà đầu tư sẵn sàng mạo hiểm để thu lợi nhuận, tuy nhiên nó mang trong mình nguy cơ rủi ro khá cao. Chính vì vậy trước khi tiến hành giao dịch cần phải xem xét mọi mặt vấn đề chấp nhận tiến hành giao dịch cụ thể xét theo quan điểm của nguồn lực tài chính sẵn có và mức độ am hiểu thị trường tài chính.
Sử dụng thông tin: sử dụng toàn bộ hay riêng biệt các dữ liệu trên trang web của công ty TeleTrade như một nguồn cung cấp thông tin nhất định. Việc sử dụng tư liệu từ trang web cần kèm theo liên kết đến trang teletrade.vn. Việc tự động thu thập số liệu cũng như thông tin từ trang web TeleTrade đều không được phép.
Xin vui lòng liên hệ với pr@teletrade.global nếu có câu hỏi.
ngân hàng