- Phân tích
- Tin tức và các công cụ
- Tin tức thị trường
- AUD/USD Price Analysis: Flirts with weekly low, around mid-0.6700s or 50% Fibo. support
AUD/USD Price Analysis: Flirts with weekly low, around mid-0.6700s or 50% Fibo. support
- AUD/USD meets with a fresh supply on Friday and drops back closer to the weekly low.
- China’s economic woes undermine the Aussie and exert pressure amid a stronger USD.
- A sustained breakdown below the 50% Fibo. should pave the way for deeper losses.
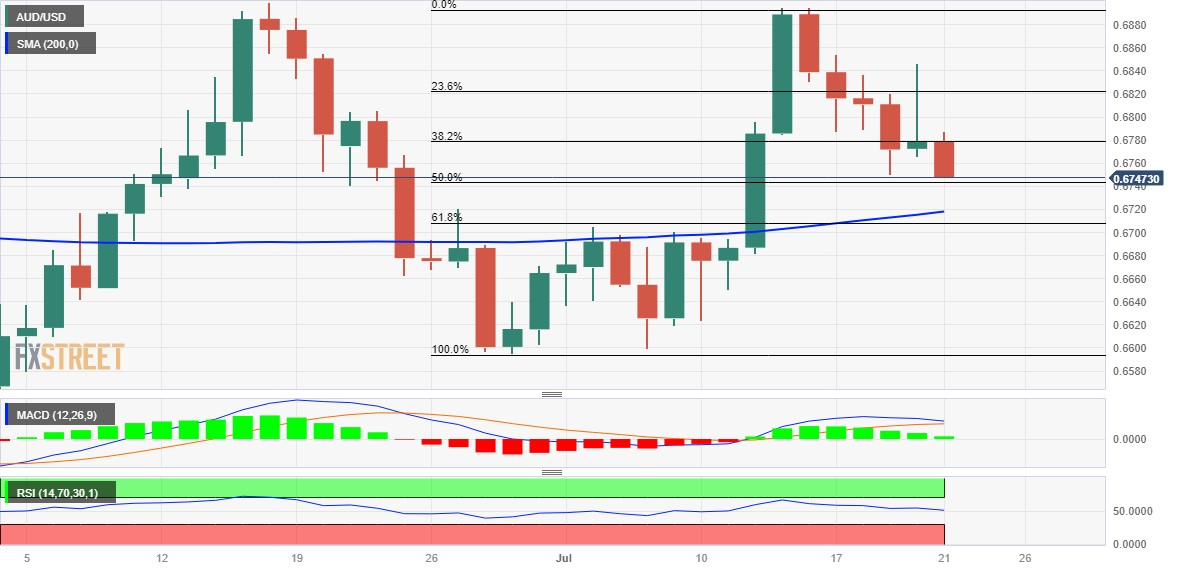
The AUD/USD pair extends the previous day's sharp pullback from the vicinity of mid-0.6800s, or the weekly high and drifts lower through the early part of the European session on Friday. Spot prices currently trade around the 0.6750 region, which represents the weekly trough touched on Wednesday and the 50% Fibonacci retracement level of the recent rally from sub-0.6600 levels touched in late June.
Concerns over slowing economic growth in China, the worsening US-China trade ties and geopolitical risks overshadow the upbeat Australian jobs data released on Thursday, which puts pressure on the Reserve Bank of Australia (RBA) to hike further. This, along with a goodish pickup in the US Dollar (USD) demand, bolstered by a sharp fall in the Japanese Yen, exerts some downward pressure on the AUD/USD pair.
From a technical perspective, the recent failure near the 0.6900 round figure constitutes the formation of a bearish double-top pattern on the daily chart. That said, oscillators on the daily chart - though have been losing positive traction - are yet to confirm a negative outlook. This makes it prudent to wait for some follow-through selling below the 0.6750 support before positioning for any further intraday depreciating move.
The AUD/USD pair might then accelerate the fall towards challenging a technically significant 200-day Simple Moving Average (SMA), currently pegged just above the 0.6700 mark. The said handle coincides with the 61.8% Fibo. level, which if broken decisively will be seen as a fresh trigger for bearish traders and drag spot prices to the 0.6655-0.6650 intermediate support en route to sub-0.6600 levels, or the monthly low.
On the flip side, the 38.2% Fibo. level, around the 0.6775-0.6780 region, now seems to act as an immediate hurdle ahead of the 0.6800 mark. and the 0.6825 zone, or the 23.6% Fibo. A sustained strength beyond should allow the AUD/USD pair to make a fresh attempt to conquer the 0.6900 double-top barrier. Some follow-through buying will negate the bearish pattern and shift the near-term bias back in favour of bullish traders.
The subsequent short-covering rally has the potential to lift the AUD/USD pair to the 0.6970-0.6975 next relevant hurdle. This is closely followed by the 0.7000 psychological mark, above which the upward trajectory could get extended further towards the 0.7050-0.7055 area en route to the 0.7100 round figure. Spot prices could eventually climb to the YTD peak, around the 0.7155-0.7160 region touched in February.
AUD/USD daily chart
Key levels to watch


© 2000-2026. Bản quyền Teletrade.
Trang web này được quản lý bởi Teletrade D.J. LLC 2351 LLC 2022 (Euro House, Richmond Hill Road, Kingstown, VC0100, St. Vincent and the Grenadines).
Thông tin trên trang web không phải là cơ sở để đưa ra quyết định đầu tư và chỉ được cung cấp cho mục đích làm quen.
Giao dịch trên thị trường tài chính (đặc biệt là giao dịch sử dụng các công cụ biên) mở ra những cơ hội lớn và tạo điều kiện cho các nhà đầu tư sẵn sàng mạo hiểm để thu lợi nhuận, tuy nhiên nó mang trong mình nguy cơ rủi ro khá cao. Chính vì vậy trước khi tiến hành giao dịch cần phải xem xét mọi mặt vấn đề chấp nhận tiến hành giao dịch cụ thể xét theo quan điểm của nguồn lực tài chính sẵn có và mức độ am hiểu thị trường tài chính.
Sử dụng thông tin: sử dụng toàn bộ hay riêng biệt các dữ liệu trên trang web của công ty TeleTrade như một nguồn cung cấp thông tin nhất định. Việc sử dụng tư liệu từ trang web cần kèm theo liên kết đến trang teletrade.vn. Việc tự động thu thập số liệu cũng như thông tin từ trang web TeleTrade đều không được phép.
Xin vui lòng liên hệ với pr@teletrade.global nếu có câu hỏi.
ngân hàng