- Phân tích
- Tin tức và các công cụ
- Tin tức thị trường
- USD/MXN Price Analysis: Bears have the upper hand near 200-hour SMA/61.8% Fibo. confluence
USD/MXN Price Analysis: Bears have the upper hand near 200-hour SMA/61.8% Fibo. confluence
- USD/MXN is seen consolidating in a narrow trading band through the early European session.
- The technical setup favours bearish traders and supports prospects for a retest of the YTD low.
- A move back above the 23.6% Fibo. level is needed to negate the near-term bearish outlook.
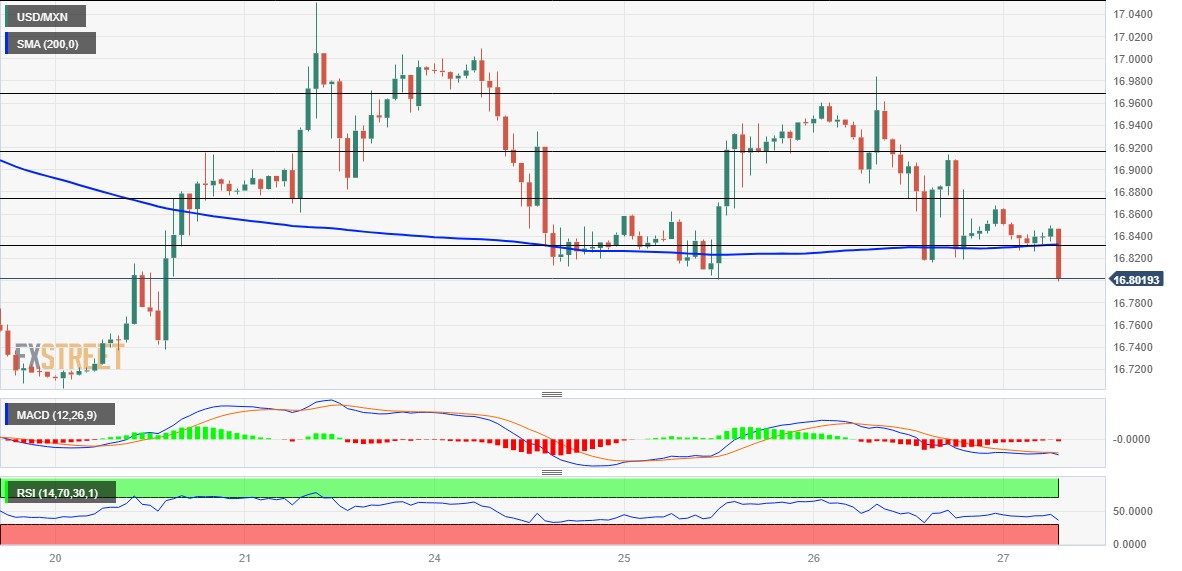
The USD/MXN pair lacks any firm intraday direction on Thursday and oscillates in a narrow trading band, below the 16.85 level through the early European session.
From a technical perspective, spot prices currently hover around the confluence comprising of the 200-hour Simple Moving Average (SMA) and the 61.8% Fibonacci retracement level of the recent modest recovery from the lowest level since December 2015. Some follow-through selling below the overnight swing low, around the 16.80 area, will be seen as a fresh trigger for bearish traders and pave the way for a further near-term depreciating move.
Meanwhile, oscillators on the daily chart - though have been recovering - are still holding in the bearish territory and have again started gaining negative traction on hourly charts. This, in turn, suggests that the path of least resistance for the USD/MXN pair is to the downside. Hence, a subsequent slide back towards challenging the multi-year low, around the 16.70 region touched last week, looks like a distinct possibility.
Sustained weakness below the latter will be seen as a fresh trigger for bearish traders and expose the next relevant support near the 16.60 region. The USD/MXN pair could extend the downward trajectory and eventually drop to October/November 2015 lows, around the 16.3555-16.3250 area.
On the flip side, the 50% Fibo. level, around the 16.8740-16.8745 region now seems to act as an immediate strong barrier. A sustained strength beyond might trigger a short-covering move towards the 16.9200 zone en route to the 16.9600-16.9700 supply zone. The latter coincides with the 23.6% Fibo. level, which if cleared decisively will negate the negative outlook and lift the USD/MXN back above the 17.00 mark.
USD/MXN 1-hour chart
Key levels to watch


© 2000-2026. Bản quyền Teletrade.
Trang web này được quản lý bởi Teletrade D.J. LLC 2351 LLC 2022 (Euro House, Richmond Hill Road, Kingstown, VC0100, St. Vincent and the Grenadines).
Thông tin trên trang web không phải là cơ sở để đưa ra quyết định đầu tư và chỉ được cung cấp cho mục đích làm quen.
Giao dịch trên thị trường tài chính (đặc biệt là giao dịch sử dụng các công cụ biên) mở ra những cơ hội lớn và tạo điều kiện cho các nhà đầu tư sẵn sàng mạo hiểm để thu lợi nhuận, tuy nhiên nó mang trong mình nguy cơ rủi ro khá cao. Chính vì vậy trước khi tiến hành giao dịch cần phải xem xét mọi mặt vấn đề chấp nhận tiến hành giao dịch cụ thể xét theo quan điểm của nguồn lực tài chính sẵn có và mức độ am hiểu thị trường tài chính.
Sử dụng thông tin: sử dụng toàn bộ hay riêng biệt các dữ liệu trên trang web của công ty TeleTrade như một nguồn cung cấp thông tin nhất định. Việc sử dụng tư liệu từ trang web cần kèm theo liên kết đến trang teletrade.vn. Việc tự động thu thập số liệu cũng như thông tin từ trang web TeleTrade đều không được phép.
Xin vui lòng liên hệ với pr@teletrade.global nếu có câu hỏi.
ngân hàng