- Phân tích
- Tin tức và các công cụ
- Tin tức thị trường
- Gold Price Forecast: XAU/USD seesaws within $1,950-70 trading range as NFP week begins – Confluence Detector
Gold Price Forecast: XAU/USD seesaws within $1,950-70 trading range as NFP week begins – Confluence Detector
- Gold Price fades recovery from 13-day low as markets prepare for US NFP with mixed feelings.
- China stimulus, weekend central bank talks fail to inspire XAU/USD bulls amid US Dollar’s rebound.
- Firmer yields, hawkish hopes from Fed keep Gold bears hopeful.
- US ISM PMIs for July, second-tier employment/inflation clues will also prod Gold traders.
Gold Price (XAU/USD) remains on the sideline, mildly offered, as market players brace for this week’s top-tier US employment and activity data. That said, the yellow metal printed the first weekly loss in four the last but failed to impress the XAU/USD nears as it recovered on Friday amid softer US inflation clues.
That said, the upbeat prints of the US growth numbers joined the Fed’s readiness for further rate hikes to weigh on the Gold Price in the last week. However, softer prints of the Fed’s preferred inflation gauge, namely the US Core Personal Consumption Expenditure (PCE) Price Index for June, put a floor under the XAU/USD price.
Recently, the mixed sentiment, despite China’s stimulus and Japan’s bond buying, allowed the US Dollar bulls to return to the desk. The same weighs on the Gold Price as the market players brace for this week’s top-tier US employment and PMI data.
Also read: Gold Price Forecast: XAU/USD ranges betweek two key DMAs ahead of top-tier Eurozone data
Gold Price: Key levels to watch
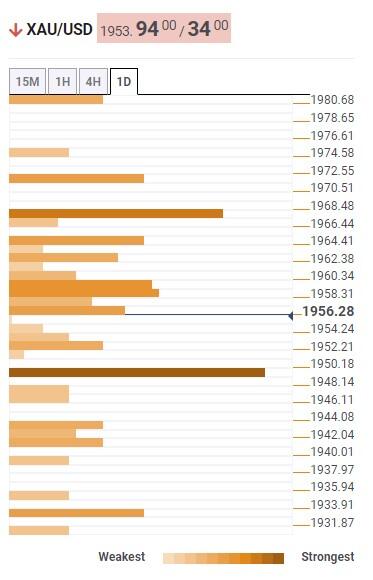
Our Technical Confluence indicator suggests the Gold Price inaction between the $1,950 and $1,970 trading range as market players brace for the top-tier data/events scheduled for release this week.
On the downside, the middle band of the Bollinger joins Pivot Point one-day S1 and Fibonacci 61.8% on one-month, around $1,950, puts a floor under the Gold Price.
Following that, the $1,930 may act as the last defense of the Gold bears before directing them to the $1,900 round figure.
Alternatively, Pivot Point one-day R1, Fibonacci 61.8% on one-week and 100-DMA caps the XAU/USD run-up around $1,970.
It’s worth noting that Pivot Point one-month R1 and one-week R1, respectively near $1,972 and $1,980, may act as additional upside filters for the Gold buyers to cross before challenging the $2,000 psychological magnet.
Here is how it looks on the tool
About Technical Confluences Detector
The TCD (Technical Confluences Detector) is a tool to locate and point out those price levels where there is a congestion of indicators, moving averages, Fibonacci levels, Pivot Points, etc. If you are a short-term trader, you will find entry points for counter-trend strategies and hunt a few points at a time. If you are a medium-to-long-term trader, this tool will allow you to know in advance the price levels where a medium-to-long-term trend may stop and rest, where to unwind positions, or where to increase your position size.


© 2000-2026. Bản quyền Teletrade.
Trang web này được quản lý bởi Teletrade D.J. LLC 2351 LLC 2022 (Euro House, Richmond Hill Road, Kingstown, VC0100, St. Vincent and the Grenadines).
Thông tin trên trang web không phải là cơ sở để đưa ra quyết định đầu tư và chỉ được cung cấp cho mục đích làm quen.
Giao dịch trên thị trường tài chính (đặc biệt là giao dịch sử dụng các công cụ biên) mở ra những cơ hội lớn và tạo điều kiện cho các nhà đầu tư sẵn sàng mạo hiểm để thu lợi nhuận, tuy nhiên nó mang trong mình nguy cơ rủi ro khá cao. Chính vì vậy trước khi tiến hành giao dịch cần phải xem xét mọi mặt vấn đề chấp nhận tiến hành giao dịch cụ thể xét theo quan điểm của nguồn lực tài chính sẵn có và mức độ am hiểu thị trường tài chính.
Sử dụng thông tin: sử dụng toàn bộ hay riêng biệt các dữ liệu trên trang web của công ty TeleTrade như một nguồn cung cấp thông tin nhất định. Việc sử dụng tư liệu từ trang web cần kèm theo liên kết đến trang teletrade.vn. Việc tự động thu thập số liệu cũng như thông tin từ trang web TeleTrade đều không được phép.
Xin vui lòng liên hệ với pr@teletrade.global nếu có câu hỏi.
ngân hàng