- Phân tích
- Tin tức và các công cụ
- Tin tức thị trường
- EUR/JPY Price Analysis: Retraces from weekly highs above 157.00 on risk-off
EUR/JPY Price Analysis: Retraces from weekly highs above 157.00 on risk-off
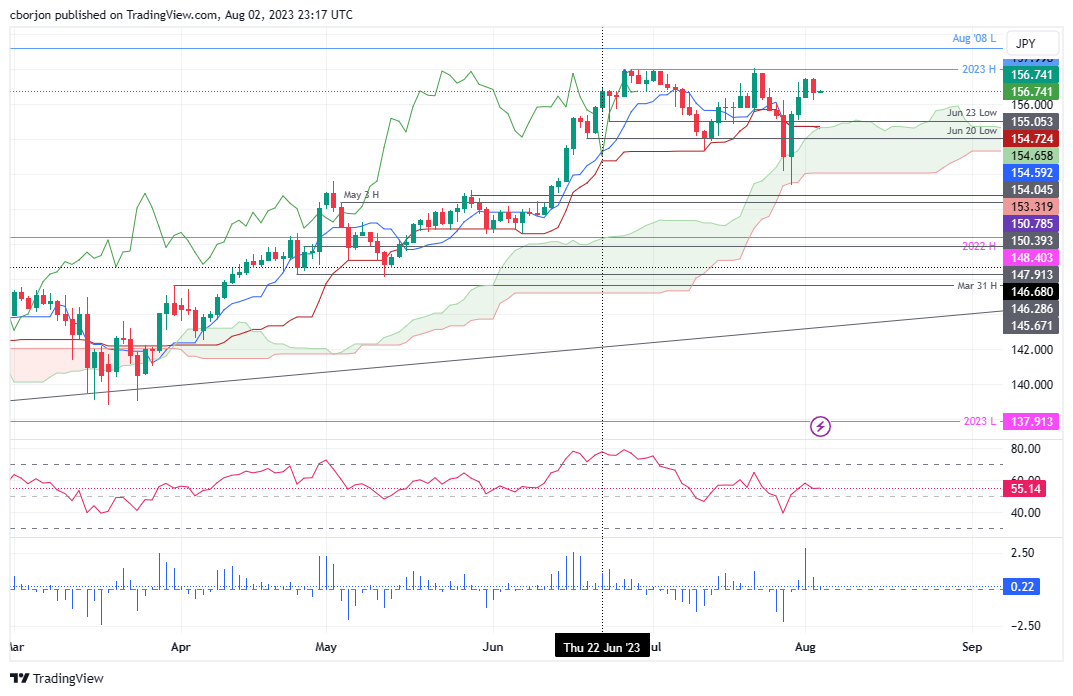
- EUR/JPY retraces from the weekly high of 157.50, falling past 157.00, trading at 156.78, failing to test the YTD high of 157.99.
- Japanese Yen’s strength is attributed to the Bank of Japan’s Yield Curve Control flexibility and a downgrade of US creditworthiness from AAA to AA+.
- Technicals show a peak around the 156.80/157.40 area, with bearish signals from the Tenkan-Sen, Kijun-Sen, and Chikou Span.
EUR/JPY retraces from weekly highs of 157.50 and drops below 157.00 as buyers failed to extend their gains and test the year-to-date (YTD) high of 157.99. The reasons behind the Japanese Yen (JPY) strength are the Yield Curve Control (YCC) flexibility imposed by the Bank of Japan (BoJ), as well as the downgrade of US creditworthiness from AAA to AA+. Therefore, the EUR/JPY tumbled and is trading at 156.78.
EUR/JPY Price Analysis: Technical outlook
The EUR/JPY appears to have peaked at around the 156.80/157.40 area, as depicted in the daily chart. The cross-currency pair has failed to decisively clear the 158.00 mark, exacerbating its fall beneath the 157.00 figure. In addition, a two-day candlestick called dark cloud cover looms, but Thursday’s price action must clear Wednesday’s daily low of 156.25 and achieve a daily close below the latter to extend its losses.
Notably, the Tenkan-Sen sits below the Kijun-Sen, at around the top of the Ichimoku Cloud (Kumo) at around 154.59/72, a bearish signal. Furthermore, the Chikou Span is positioned below the price action, suggesting that sellers could regain control in the near term.
The EUR/JPY first support would be 156.25, followed by the figure at 156.00. A breach of the latter will expose the Kijun-Sen at 154.72, followed by the Tenkan-Sen at 154.59, before dipping inside the Kumo. Conversely, if EUR/JPY reclaims 157.00, that could open the door for further upside, with buyers challenging 158.00.
EUR/JPY Price Action – Daily chart


© 2000-2026. Bản quyền Teletrade.
Trang web này được quản lý bởi Teletrade D.J. LLC 2351 LLC 2022 (Euro House, Richmond Hill Road, Kingstown, VC0100, St. Vincent and the Grenadines).
Thông tin trên trang web không phải là cơ sở để đưa ra quyết định đầu tư và chỉ được cung cấp cho mục đích làm quen.
Giao dịch trên thị trường tài chính (đặc biệt là giao dịch sử dụng các công cụ biên) mở ra những cơ hội lớn và tạo điều kiện cho các nhà đầu tư sẵn sàng mạo hiểm để thu lợi nhuận, tuy nhiên nó mang trong mình nguy cơ rủi ro khá cao. Chính vì vậy trước khi tiến hành giao dịch cần phải xem xét mọi mặt vấn đề chấp nhận tiến hành giao dịch cụ thể xét theo quan điểm của nguồn lực tài chính sẵn có và mức độ am hiểu thị trường tài chính.
Sử dụng thông tin: sử dụng toàn bộ hay riêng biệt các dữ liệu trên trang web của công ty TeleTrade như một nguồn cung cấp thông tin nhất định. Việc sử dụng tư liệu từ trang web cần kèm theo liên kết đến trang teletrade.vn. Việc tự động thu thập số liệu cũng như thông tin từ trang web TeleTrade đều không được phép.
Xin vui lòng liên hệ với pr@teletrade.global nếu có câu hỏi.
ngân hàng