- Phân tích
- Tin tức và các công cụ
- Tin tức thị trường
- Silver Price Analysis: XAG/USD refreshes multi-week low, seems vulnerable below 50% Fibo.
Silver Price Analysis: XAG/USD refreshes multi-week low, seems vulnerable below 50% Fibo.
- Silver drifts lower for the third successive day and drops to over a three-week low.
- The overnight breakdown through key technical supports favours bearish traders.
- Any attempted recovery is likely to get sold into and remain capped near $24.00.
Silver remains under some selling pressure for the third successive day on Thursday and drops to over a three-week low during the early part of the European session. The white metal currently trades around the $23.50-$23.45 region, down over 1% for the day, and seems vulnerable to prolonging its downward trajectory witnessed over the past two weeks or so.
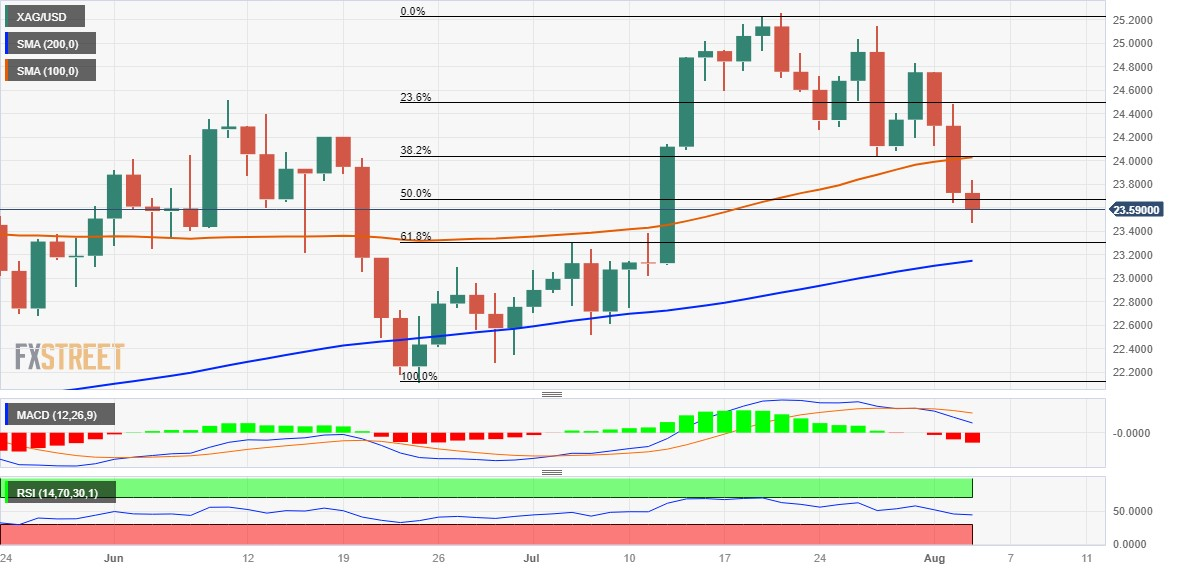
The overnight breakdown below the $24.10-$24.00 confluence, comprising the 38.2% Fibonacci retracement level of the June-July rally and the 100-day Simple Moving Average (SMA), was seen as a fresh trigger for bearish traders. The subsequent slide below the 50% Fibo. level adds credence to the negative outlook and suggests that the path of least resistance for the XAG/USD is to the downside. Moreover, technical indicators on the daily chart have just started gaining negative traction and support prospects for a further near-term depreciating move.
Hence, some follow-through weakness below the 61.8% Fibo. around the $23.35 region, towards testing the next relevant support near the $23.00 round-figure mark, looks like a distinct possibility. The latter coincides with the very important 200-day SMA, which if broken decisively will make the XAG/USD vulnerable to accelerate the downfall towards the multi-month low, around the $22.15-$22.10 area touched in June.
On the flip side, attempted recovery back above the $23.70 area, or the 50% Fibo. level is more likely to attract fresh sellers and remain capped near the $24.00 strong support breakpoint, now turned resistance. A sustained strength beyond, however, might trigger a short-covering rally and lift the XAG/USD back towards the 23.6% Fibo. level, around $24.45-$24.50 supply zone. Some follow-through buying has the potential to lift Siver towards the $24.75 intermediate hurdle en route to the $25.00 psychological mark and the $25.25 resistance zone.
The latter should act as a pivotal point, above which the XAG/USD could surpass the $25.50-$25.55 resistance zone and aim to reclaim the $26.00 mark before eventually climbing to test the YTD peak, around the $26.10-$26.15 area touched in May.
Silver daily chart
Key levels to watch


© 2000-2026. Bản quyền Teletrade.
Trang web này được quản lý bởi Teletrade D.J. LLC 2351 LLC 2022 (Euro House, Richmond Hill Road, Kingstown, VC0100, St. Vincent and the Grenadines).
Thông tin trên trang web không phải là cơ sở để đưa ra quyết định đầu tư và chỉ được cung cấp cho mục đích làm quen.
Giao dịch trên thị trường tài chính (đặc biệt là giao dịch sử dụng các công cụ biên) mở ra những cơ hội lớn và tạo điều kiện cho các nhà đầu tư sẵn sàng mạo hiểm để thu lợi nhuận, tuy nhiên nó mang trong mình nguy cơ rủi ro khá cao. Chính vì vậy trước khi tiến hành giao dịch cần phải xem xét mọi mặt vấn đề chấp nhận tiến hành giao dịch cụ thể xét theo quan điểm của nguồn lực tài chính sẵn có và mức độ am hiểu thị trường tài chính.
Sử dụng thông tin: sử dụng toàn bộ hay riêng biệt các dữ liệu trên trang web của công ty TeleTrade như một nguồn cung cấp thông tin nhất định. Việc sử dụng tư liệu từ trang web cần kèm theo liên kết đến trang teletrade.vn. Việc tự động thu thập số liệu cũng như thông tin từ trang web TeleTrade đều không được phép.
Xin vui lòng liên hệ với pr@teletrade.global nếu có câu hỏi.
ngân hàng