- Phân tích
- Tin tức và các công cụ
- Tin tức thị trường
- NZD/USD Price Analysis: Languishes near its lowest since late June, bears have the upper hand
NZD/USD Price Analysis: Languishes near its lowest since late June, bears have the upper hand
- NZD/USD remains depressed for the third straight day and hits a fresh multi-week low.
- The overnight breakdown through the 0.6145-0.6140 confluence favours bearish traders.
- Bears might now aim back to retest sub-0.6000 levels, or the YTD trough touched in May.
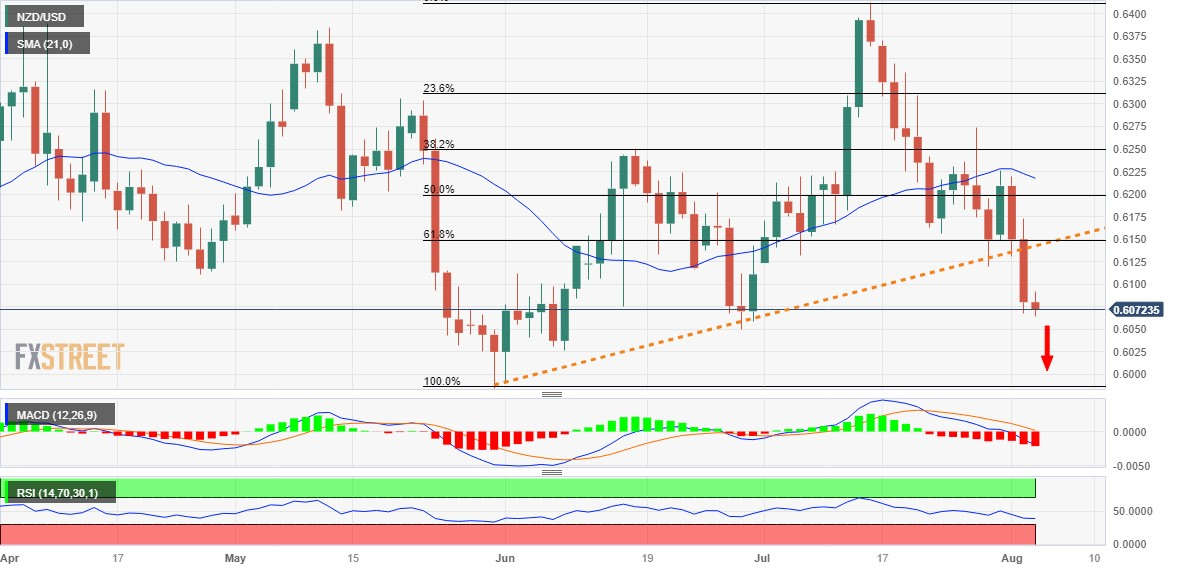
The NZD/USD pair edges lower for the third successive day – also marking the sixth day of a negative move in the previous seven – and drops to its lowest level since late June on Thursday. Spot prices remain on the defensive, around the 0.6070-0.6065 region through the early part of the European session and seem vulnerable to extending a three-week-old descending trend.
Against the backdrop of this week's failure near a technically significant 200-day Simple Moving Average (SMA), the overnight breakdown through the 0.6145-0.6140 confluence support was seen as a fresh trigger for bearish traders. The said area comprises the 61.8% Fibonacci retracement level of the May-July rally and an ascending trend-line extending from the YTD trough. This should now act as a pivotal point and cap any attempted recovery for the NZD/USD pair.
Meanwhile, technical indicators on the daily chart are holding deep in the negative territory and are still far from being in the oversold territory, adding credence to the bearish outlook for the NZD/USD pair. Some follow-through selling below the 0.6050 area (June 29 low) will reaffirm the negative bias and make spot prices vulnerable to accelerate the downward trajectory towards the 0.6000 psychological mark en route to the YTD low, around the 0.5985 region touched in May.
On the flip side, the 0.6100 round figure now seems to act as an immediate barrier ahead of the 0.6140-0.6145 confluence support breakpoint, now turned resistance. A sustained strength beyond might trigger a short-covering rally and allow the NZD/USD pair to aim back to reclaim the 0.6200 mark, which coincides with the 50% Fibo. level. This is closely followed by the 200-day SMA, around the 0.6220-0.6225 region, which if cleared could negate the negative outlook.
NZD/USD daily chart
Key levels to watch


© 2000-2026. Bản quyền Teletrade.
Trang web này được quản lý bởi Teletrade D.J. LLC 2351 LLC 2022 (Euro House, Richmond Hill Road, Kingstown, VC0100, St. Vincent and the Grenadines).
Thông tin trên trang web không phải là cơ sở để đưa ra quyết định đầu tư và chỉ được cung cấp cho mục đích làm quen.
Giao dịch trên thị trường tài chính (đặc biệt là giao dịch sử dụng các công cụ biên) mở ra những cơ hội lớn và tạo điều kiện cho các nhà đầu tư sẵn sàng mạo hiểm để thu lợi nhuận, tuy nhiên nó mang trong mình nguy cơ rủi ro khá cao. Chính vì vậy trước khi tiến hành giao dịch cần phải xem xét mọi mặt vấn đề chấp nhận tiến hành giao dịch cụ thể xét theo quan điểm của nguồn lực tài chính sẵn có và mức độ am hiểu thị trường tài chính.
Sử dụng thông tin: sử dụng toàn bộ hay riêng biệt các dữ liệu trên trang web của công ty TeleTrade như một nguồn cung cấp thông tin nhất định. Việc sử dụng tư liệu từ trang web cần kèm theo liên kết đến trang teletrade.vn. Việc tự động thu thập số liệu cũng như thông tin từ trang web TeleTrade đều không được phép.
Xin vui lòng liên hệ với pr@teletrade.global nếu có câu hỏi.
ngân hàng