- Phân tích
- Tin tức và các công cụ
- Tin tức thị trường
- Gold Price Forecast: XAU/USD bears keep $1,905 and US inflation on watch – Confluence Detector
Gold Price Forecast: XAU/USD bears keep $1,905 and US inflation on watch – Confluence Detector
- Gold Price fades bounce off one-month low as US CPI looms.
- Cautious optimism, sluggish US Dollar joins pre-data anxiety to prod XAU/USD traders.
- Mixed feelings about China underpin XAU/USD consolidation despite impending trade war, economic fears.
- Softer US inflation can extend the Gold Price recovery as downbeat US NFP flagged Fed policy pivot concerns.
Gold Price (XAU/USD) struggles to defend the first daily gains at the lowest level in a month as the market braces for the US inflation data, namely the Consumer Price Index (CPI) for July. Adding strength to the XAU/USD rebound is the slightly positive market sentiment as the US-China trade war and looming Sino-UK tension fail to spoil the market’s mood as China policymakers show confidence in taming the economic fears.
Further, the Gold Price rebound could also be linked to the mildly bid stock futures and the Asia-Pacific shares, not to forget the Reserve Bank of India’s (RBI) inaction. However, the corrective bounce in the yields and fears that the US CPI will offer a positive surprise and defy the concerns about the Fed policy pivot, especially backed by the previous week’s downbeat US jobs report and early signals of inflation, could recall the XAU/USD sellers.
Also read: Gold Price Forecast: XAU/USD could test 200 DMA on hot US Consumer Price Index data
Gold Price: Key levels to watch
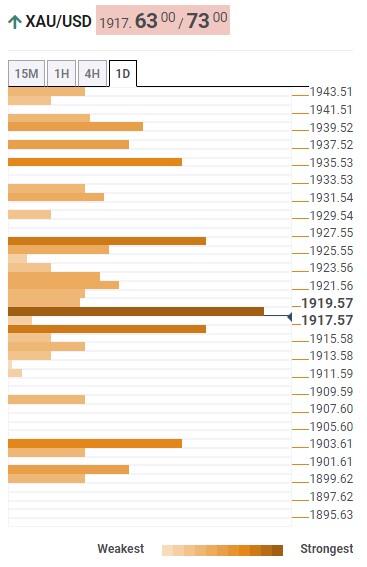
Our Technical Confluence indicator suggests that the Gold Price struggles to overcome the immediate upside hurdle surrounding $1,918-20 comprising the lower band of the Bollinger and Fibonacci 23.6% on one-day.
It’s worth noting that the XAU/USD downside needs validation from the Pivot Point one-month S1, around $1,915.
Following that, the Gold bears will have a space before hitting the $1,905 support confluence including the previous monthly low. However, the Pivot Point one-week S2, around the $1,900 round figure, can challenge the XAU/USD bears past $1,905.
In a case where the Gold Price drops below the $1,900 threshold, June’s low of $1,893 will be in the spotlight.
Alternatively, a clear upside break of the aforementioned $1,918-20 resistance confluence could quickly fuel the Gold Price towards the previous weekly low and the Pivot Point one-day R1, close to $1,930.
If the Gold buyers manage to stay keep the reins past $1,930, Fibonacci 61.8% in one-month, near $1,938, may test the buyers before directing them to the multi-day resistance area surrounding $1,955.
Here is how it looks on the tool
About Technical Confluences Detector
The TCD (Technical Confluences Detector) is a tool to locate and point out those price levels where there is a congestion of indicators, moving averages, Fibonacci levels, Pivot Points, etc. If you are a short-term trader, you will find entry points for counter-trend strategies and hunt a few points at a time. If you are a medium-to-long-term trader, this tool will allow you to know in advance the price levels where a medium-to-long-term trend may stop and rest, where to unwind positions, or where to increase your position size.


© 2000-2026. Bản quyền Teletrade.
Trang web này được quản lý bởi Teletrade D.J. LLC 2351 LLC 2022 (Euro House, Richmond Hill Road, Kingstown, VC0100, St. Vincent and the Grenadines).
Thông tin trên trang web không phải là cơ sở để đưa ra quyết định đầu tư và chỉ được cung cấp cho mục đích làm quen.
Giao dịch trên thị trường tài chính (đặc biệt là giao dịch sử dụng các công cụ biên) mở ra những cơ hội lớn và tạo điều kiện cho các nhà đầu tư sẵn sàng mạo hiểm để thu lợi nhuận, tuy nhiên nó mang trong mình nguy cơ rủi ro khá cao. Chính vì vậy trước khi tiến hành giao dịch cần phải xem xét mọi mặt vấn đề chấp nhận tiến hành giao dịch cụ thể xét theo quan điểm của nguồn lực tài chính sẵn có và mức độ am hiểu thị trường tài chính.
Sử dụng thông tin: sử dụng toàn bộ hay riêng biệt các dữ liệu trên trang web của công ty TeleTrade như một nguồn cung cấp thông tin nhất định. Việc sử dụng tư liệu từ trang web cần kèm theo liên kết đến trang teletrade.vn. Việc tự động thu thập số liệu cũng như thông tin từ trang web TeleTrade đều không được phép.
Xin vui lòng liên hệ với pr@teletrade.global nếu có câu hỏi.
ngân hàng