- Phân tích
- Tin tức và các công cụ
- Tin tức thị trường
- Gold Price Forecast: XAU/USD nears key $1,940 resistance amid US data focus – Confluence Detector
Gold Price Forecast: XAU/USD nears key $1,940 resistance amid US data focus – Confluence Detector
- Gold Price remains firmer around two-week high as bulls cheer softer US Dollar, cautious optimism.
- US Dollar traces downbeat yields amid uncertainty about Fed’s next moves and anxiety ahead of Consumer Confidence data.
- Hopes of more stimulus from China add strength to XAU/USD run-up after snapping the four-week losing streak.
- Gold Price approaches key upside hurdle as top-tier US statistics loom.
Gold Price (XAU/USD) defends the previous weekly recovery, the first in five, as it rises for the second consecutive day amid the broad US Dollar weakness. Also adding strength to the XAU/USD rebound is the cautious optimism in the market, as well as the downbeat Treasury bond yields.
It’s worth noting that the US Dollar Index (DXY) cheers the Fed policymakers’ data dependency and recent mixed US data, as well as a sustained pullback in the US Treasury bond yields from the multi-year high marked last week.
Elsewhere, hopes of more stimulus from China via fiscal, as well as monetary policy, keep the Gold buyers hopeful.
However, the cautious mood ahead of the US inflation and employment clues, as well as China activity data, prod the XAU/USD bulls around the key $1,940 resistance confluence.
To sum up, the Gold Price has the majority of catalysts needed for the further upside but $1,940 and broad US Dollar weakness, as well as the downbeat yields, will decide the further advances of the XAU/USD.
Also read: Gold Price Forecast: Tide turns in favor of XAU/USD buyers, US jobs data awaited
Gold Price: Key levels to watch
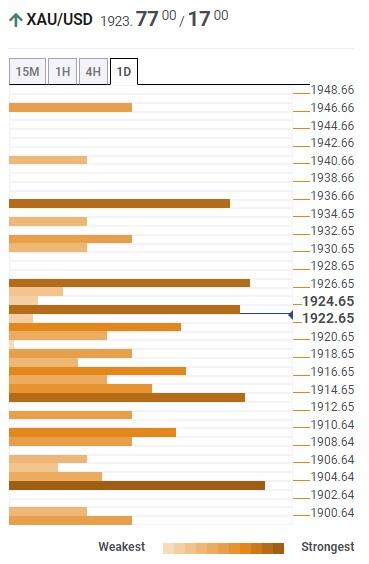
As per our Technical Confluence indicator, the Gold Price floats within a $40 region multiple resistance area ahead of this week’s top-tier US inflation and employment clues.
That said, a convergence of the Pivot Point one-day R1 and the previous daily high guards the immediate recovery of the Gold Price near $1,928.
Following that, the 200-SMA on the four-hour (4H) chart and Fibonacci 61.8% on one-month, around $1,937, restricts further upside of the Gold Price.
In a case where the XAU/USD buyers keep the reins past $1,937, the Pivot Point one-week R2 around $1,945 will act as the last defense of the Gold sellers.
On the flip side, a convergence of the 5-DMA, previous daily low, Fibonacci 23.6% on one-week and Pivot Point one-day S1 together restrict the immediate Gold Price downside near $1,910.
Should the XAU/USD bears manage to conquer the $1,910 key support, the 10-DMA, previous monthly low and Fibonacci 161.8% on weekly chart, close to $1,900 at the latest, will act as the last check for the sellers.
Here is how it looks on the tool
About Technical Confluences Detector
The TCD (Technical Confluences Detector) is a tool to locate and point out those price levels where there is a congestion of indicators, moving averages, Fibonacci levels, Pivot Points, etc. If you are a short-term trader, you will find entry points for counter-trend strategies and hunt a few points at a time. If you are a medium-to-long-term trader, this tool will allow you to know in advance the price levels where a medium-to-long-term trend may stop and rest, where to unwind positions, or where to increase your position size.


© 2000-2026. Bản quyền Teletrade.
Trang web này được quản lý bởi Teletrade D.J. LLC 2351 LLC 2022 (Euro House, Richmond Hill Road, Kingstown, VC0100, St. Vincent and the Grenadines).
Thông tin trên trang web không phải là cơ sở để đưa ra quyết định đầu tư và chỉ được cung cấp cho mục đích làm quen.
Giao dịch trên thị trường tài chính (đặc biệt là giao dịch sử dụng các công cụ biên) mở ra những cơ hội lớn và tạo điều kiện cho các nhà đầu tư sẵn sàng mạo hiểm để thu lợi nhuận, tuy nhiên nó mang trong mình nguy cơ rủi ro khá cao. Chính vì vậy trước khi tiến hành giao dịch cần phải xem xét mọi mặt vấn đề chấp nhận tiến hành giao dịch cụ thể xét theo quan điểm của nguồn lực tài chính sẵn có và mức độ am hiểu thị trường tài chính.
Sử dụng thông tin: sử dụng toàn bộ hay riêng biệt các dữ liệu trên trang web của công ty TeleTrade như một nguồn cung cấp thông tin nhất định. Việc sử dụng tư liệu từ trang web cần kèm theo liên kết đến trang teletrade.vn. Việc tự động thu thập số liệu cũng như thông tin từ trang web TeleTrade đều không được phép.
Xin vui lòng liên hệ với pr@teletrade.global nếu có câu hỏi.
ngân hàng