- Phân tích
- Tin tức và các công cụ
- Tin tức thị trường
- Silver Price Analysis: XAG/USD plummets to two-week low, bears flirt with 50% Fibo.
Silver Price Analysis: XAG/USD plummets to two-week low, bears flirt with 50% Fibo.
- Silver remains under heavy selling pressure for the fifth straight day on Tuesday.
- A sustained break below the 200-period SMA on the 4-hour chart favours bears.
- The oversold RSI on hourly charts makes it prudent to wait for some consolidation.
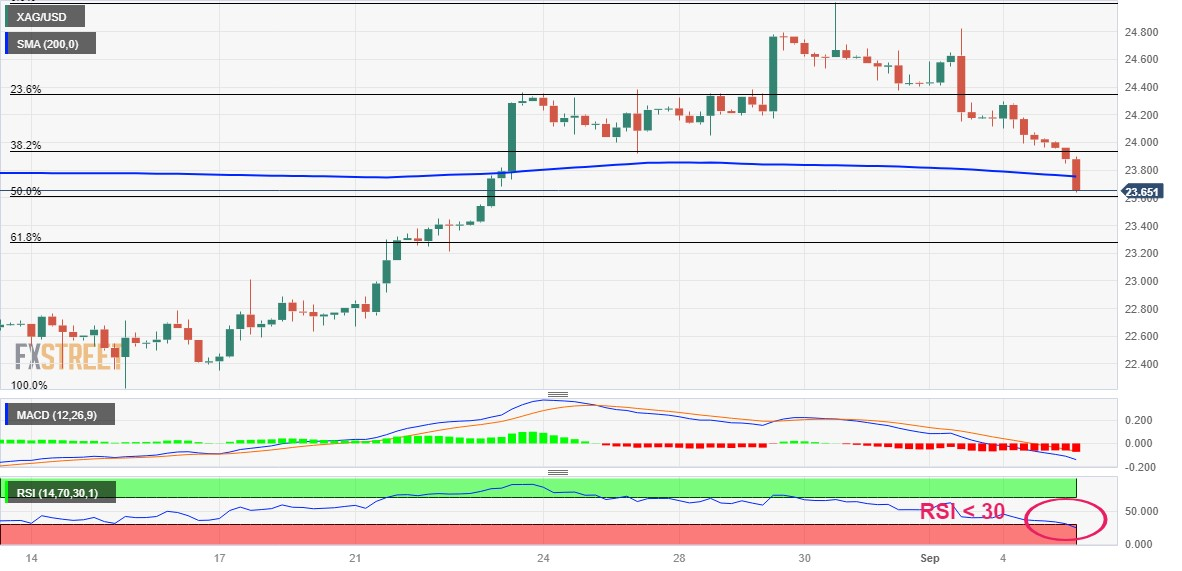
Silver prolongs last week's rejection slide from the $25.00 psychological mark, or over a one-month peak and continues to lose ground for the fifth successive day on Tuesday. The downfall remains uninterrupted through the early European session and drags the white metal to a two-week low, around the $23.65 region in the last hour.
From a technical perspective, sustained break and acceptance below the $23.80-$23.75 area, representing the 200-period Simple Moving Average (SMA) on the 4-hour chart could be seen as a fresh trigger for bearish traders. Moreover, oscillators on the daily chart have just started gaining negative traction and support prospects for a further near-term depreciating move. That said, the Relative Strength Index (RSI) on hourly charts is flashing oversold conditions and might assist the XAG/USD to consolidate near current levels, representing the 50% Fibonacci retracement level of $22.25-$25.00 rally.
A convincing break below, however, will make silver vulnerable to accelerate the fall towards the 61.8% Fibo. level, around the $23.30-$23.25 region en route to the $23.00 round-figure mark. The downward trajectory could get extended further and drag the XAG/USD further below the $22.65-$22.60 area, towards challenging a strong horizontal support near the $22.20-$22.10 zone.
On the flip side, the 200-period SMA breakpoint, around the $23.75-$23.80 region, now seems to act as an immediate barrier ahead of the $24.00 round-figure mark. The latter represents the 38.2% Fibo. level, above which a bout of a short-covering move has the potential to lift the XAG/USD towards the 23.6% Fibo. level, around the $24.30-$24.35 area. Some follow-through buying might expose a four-month-old descending trend line resistance, currently near the $24.70-$24.75 zone. A sustained breakthrough, leading to a subsequent strength beyond the $25.00 mark, might shift the bias in favour of bullish traders.
Silver 4-hour chart
Technical levels to watch


© 2000-2026. Bản quyền Teletrade.
Trang web này được quản lý bởi Teletrade D.J. LLC 2351 LLC 2022 (Euro House, Richmond Hill Road, Kingstown, VC0100, St. Vincent and the Grenadines).
Thông tin trên trang web không phải là cơ sở để đưa ra quyết định đầu tư và chỉ được cung cấp cho mục đích làm quen.
Giao dịch trên thị trường tài chính (đặc biệt là giao dịch sử dụng các công cụ biên) mở ra những cơ hội lớn và tạo điều kiện cho các nhà đầu tư sẵn sàng mạo hiểm để thu lợi nhuận, tuy nhiên nó mang trong mình nguy cơ rủi ro khá cao. Chính vì vậy trước khi tiến hành giao dịch cần phải xem xét mọi mặt vấn đề chấp nhận tiến hành giao dịch cụ thể xét theo quan điểm của nguồn lực tài chính sẵn có và mức độ am hiểu thị trường tài chính.
Sử dụng thông tin: sử dụng toàn bộ hay riêng biệt các dữ liệu trên trang web của công ty TeleTrade như một nguồn cung cấp thông tin nhất định. Việc sử dụng tư liệu từ trang web cần kèm theo liên kết đến trang teletrade.vn. Việc tự động thu thập số liệu cũng như thông tin từ trang web TeleTrade đều không được phép.
Xin vui lòng liên hệ với pr@teletrade.global nếu có câu hỏi.
ngân hàng