- Phân tích
- Tin tức và các công cụ
- Tin tức thị trường
- USD/MXN Price Analysis: Flirts with 100-day SMA support, below 38.2% Fibo. level
USD/MXN Price Analysis: Flirts with 100-day SMA support, below 38.2% Fibo. level
- USD/MXN stalls its retracement slide from a multi-month top near the 100-day SMA support.
- Positive oscillators on the daily chart warrant caution before placing aggressive bearish bets.
- Strength back above the 38.2% Fibo. level will set the stage for a further appreciating move.
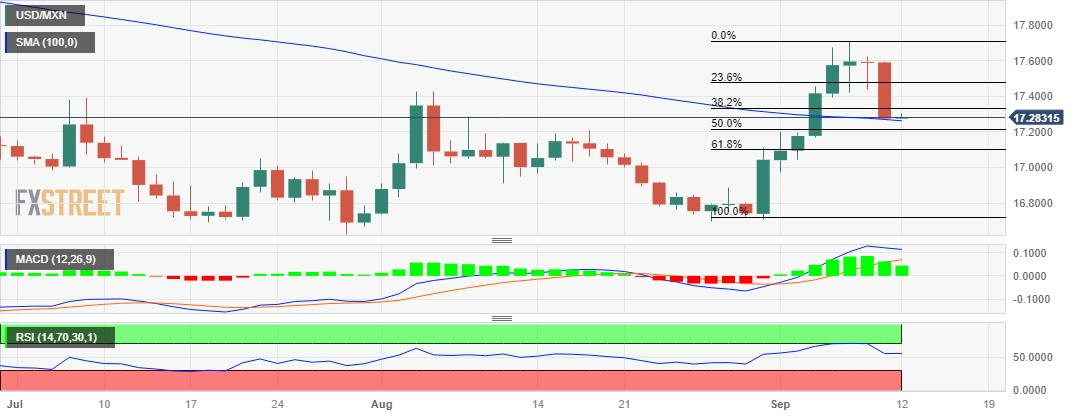
The USD/MXN pair finds some support near the 100-day Simple Moving Average (SMA), currently around the 17.25 region, and for now, seems to have stalled its retracement slide from over a three-month peak touched last week. Spot prices, however, struggle to register any meaningful recovery and remain below the 17.30 level through the Asian session.
From a technical perspective, the overnight sustained break and acceptance below the 38.2% Fibonacci retracement level of the recent rally from the August monthly swing low favours bearish traders. That said, oscillators on the daily chart –though have been easing from higher levels – are still holding in the positive territory. This, in turn, warrants some caution before positioning for any further depreciating move.
A convincing break below the 100-day SMA, however, might prompt some technical selling and expose the 50% Fibo. level, around the 17.20 level. The subsequent fall has the potential to drag the USD/MXN pair towards the 17.10 region, or the 61.8% Fibo. level. The latter should act as a key pivotal point, which if broken decisively could make spot prices vulnerable to extend the decline further below the 17.00 mark.
On the flip side, the 38.2% Fibo. level, around the 17.35 region, is likely to cap the immediate upside, above which the USD/MXN pair could climb to the 17.45-17.50 hurdle, or the 23.6% Fibo. level. This is followed by the multi-month top, around the 17.70 zone, which if cleared decisively will set the stage for the resumption of the recent strong appreciating move witnessed over the past two weeks or so.
USD/MXN daily chart
Technical levels to watch


© 2000-2026. Bản quyền Teletrade.
Trang web này được quản lý bởi Teletrade D.J. LLC 2351 LLC 2022 (Euro House, Richmond Hill Road, Kingstown, VC0100, St. Vincent and the Grenadines).
Thông tin trên trang web không phải là cơ sở để đưa ra quyết định đầu tư và chỉ được cung cấp cho mục đích làm quen.
Giao dịch trên thị trường tài chính (đặc biệt là giao dịch sử dụng các công cụ biên) mở ra những cơ hội lớn và tạo điều kiện cho các nhà đầu tư sẵn sàng mạo hiểm để thu lợi nhuận, tuy nhiên nó mang trong mình nguy cơ rủi ro khá cao. Chính vì vậy trước khi tiến hành giao dịch cần phải xem xét mọi mặt vấn đề chấp nhận tiến hành giao dịch cụ thể xét theo quan điểm của nguồn lực tài chính sẵn có và mức độ am hiểu thị trường tài chính.
Sử dụng thông tin: sử dụng toàn bộ hay riêng biệt các dữ liệu trên trang web của công ty TeleTrade như một nguồn cung cấp thông tin nhất định. Việc sử dụng tư liệu từ trang web cần kèm theo liên kết đến trang teletrade.vn. Việc tự động thu thập số liệu cũng như thông tin từ trang web TeleTrade đều không được phép.
Xin vui lòng liên hệ với pr@teletrade.global nếu có câu hỏi.
ngân hàng