- Phân tích
- Tin tức và các công cụ
- Tin tức thị trường
- USD/INR Price Analysis: Bounces off one-week low, remains below 83.00 mark
USD/INR Price Analysis: Bounces off one-week low, remains below 83.00 mark
- USD/INR states a modest recovery from a one-week low touched this Thursday.
- The technical setup favours bulls and supports prospects for a further move up.
- A convincing break below the 100/200-day SMAs will negate the positive bias.
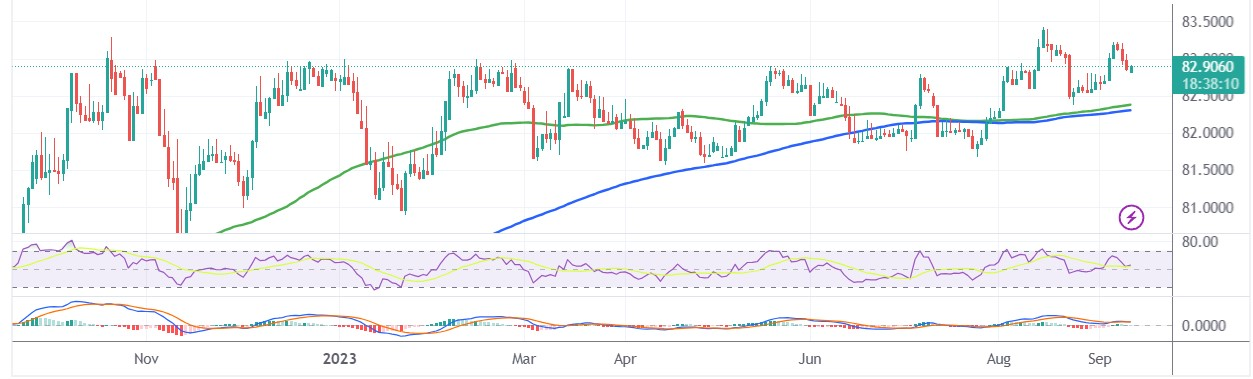
The USD/INR pair attracts some dip-buying near the 82.80 area, or a one-week low touched during the Asian session this Tuesday and for now, seems to have snapped a three-day losing streak. Spot prices, however, remain below the 83.00 round-figure mark, the near-term bias seems tilted in favour of bullish traders.
The positive outlook is reinforced by the fact that the USD/INR pair is holding comfortably above technically significant 100-day and 200-day Simple Moving Averages (SMAs). Moreover, positive oscillators on the daily chart – though have been losing some traction – suggest that the path of least resistance for spot prices is to the upside.
A sustained strength beyond the 83.00 mark will reaffirm the constructive setup and lift the pair back towards last week's swing high, around the 83.20-83.25 region. This is followed by the 83.45 region, or the record high touched in August, which if cleared decisively will be seen as a fresh trigger for bulls and pave the way for additional gains.
On the flip side, weakness below the 82.80-82.75 region might continue to attract some dip-buying and remain limited near the 82.40-82.30 confluence, comprising the 100-day and the 200-day SMAs. The latter should act as a pivotal point, which if broken will make the USD/INR pair vulnerable to accelerate the slide towards the 82.00 round figure.
Some follow-through selling below the July monthly swing low, around the 81.70-81.65 region, will suggest that spot prices have formed a near-term top and pave the way for a deeper corrective decline. The USD/INR pair might then weaken further towards the 81.35 intermediate support before eventually dropping towards testing sub-81.00 levels.
USD/INR daily chart
Technical levels to watch


© 2000-2026. Bản quyền Teletrade.
Trang web này được quản lý bởi Teletrade D.J. LLC 2351 LLC 2022 (Euro House, Richmond Hill Road, Kingstown, VC0100, St. Vincent and the Grenadines).
Thông tin trên trang web không phải là cơ sở để đưa ra quyết định đầu tư và chỉ được cung cấp cho mục đích làm quen.
Giao dịch trên thị trường tài chính (đặc biệt là giao dịch sử dụng các công cụ biên) mở ra những cơ hội lớn và tạo điều kiện cho các nhà đầu tư sẵn sàng mạo hiểm để thu lợi nhuận, tuy nhiên nó mang trong mình nguy cơ rủi ro khá cao. Chính vì vậy trước khi tiến hành giao dịch cần phải xem xét mọi mặt vấn đề chấp nhận tiến hành giao dịch cụ thể xét theo quan điểm của nguồn lực tài chính sẵn có và mức độ am hiểu thị trường tài chính.
Sử dụng thông tin: sử dụng toàn bộ hay riêng biệt các dữ liệu trên trang web của công ty TeleTrade như một nguồn cung cấp thông tin nhất định. Việc sử dụng tư liệu từ trang web cần kèm theo liên kết đến trang teletrade.vn. Việc tự động thu thập số liệu cũng như thông tin từ trang web TeleTrade đều không được phép.
Xin vui lòng liên hệ với pr@teletrade.global nếu có câu hỏi.
ngân hàng