- Phân tích
- Tin tức và các công cụ
- Tin tức thị trường
- USD/CAD dips into 1.3480 as oil continues to bolster crude-dependent Loonie
USD/CAD dips into 1.3480 as oil continues to bolster crude-dependent Loonie
- Oil prices are surging thanks to ongoing supply constraint concerns, sending the CAD soaring against the USD.
- The Federal Reserve's latest rate call is expected to hold steady in the midweek.
- Economic Calendar sees several high-impact figures for both the USD and CAD this week.
The USD/CAD continues to tip to the downside as the Loonie (CAD) gets pushed higher by rising oil prices.
Oil prices continue to chew through chart paper, with West Texas Intermediary (WTI) US crude oil marking a fresh high of $91/bbl in Monday trading.
The USD/CAD is testing into five-week lows as the US Dollar (USD) gives up ground against the commodity-supported CAD, but the midweek sees the Federal Reserve (Fed) landing with another rate call. Markets are broadly expecting the Federal Open Market Committee (FOMC) to hold steady with interest rates at 5%.
Fed's rate call in the pipe for the mid-week, US data to dominate market reactions
Oil prices will be driving the USD/CAD for the early week, but the economic calendar will see plenty of Greenback-based momentum from Wednesday onwards. However, before any of that can happen, the CAD will see Consumer Price Index (CPI) figures for Canada on Tuesday.
The Canadian CPI is scheduled for 12:30 GMT Tuesday, and is expected to climb to 3.8% from the previous 3.3% as the Bank of Canada (BoC) struggles to contain inflation largely bolstered by rising energy prices.
Thursday will bring US Initial Jobless Claims which lasted printed at 220K, while Friday sees Canadian Retail Sales for July, forecast to tick higher from 0.1% to 0.4%.
US Manufacturing and Services Purchasing Manager Index (PMI) data is also slated for Friday. The Manufacturing PMI is expected to decline slightly from 47.9 to 47.8, while the services component is seen declining from 50.5 to 50.3.
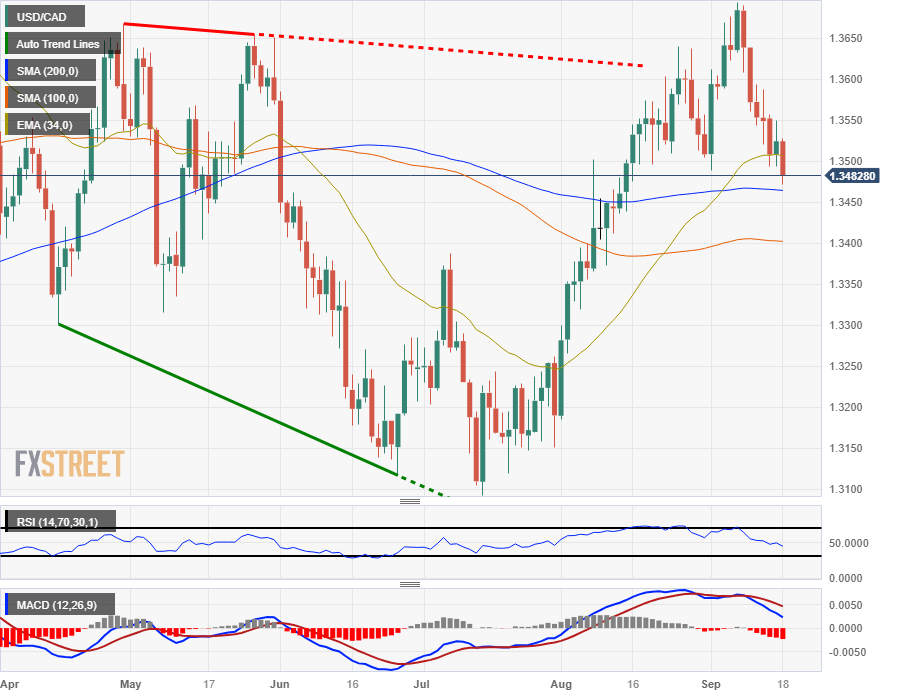
USD/CAD technical outlook
The Dollar-Loonie pairing is trading to the midpoint of familiar territory initially reached in late 2022, and the pair is rapidly approaching the 200-day Simple Moving Average (SMA) near 1.3464 as prices slip past the 34-day Exponential Moving Average (EMA), currently turning bearish into 1.3505.
The Relative Strength Index (RSI) and Moving Average Convergence-Divergence (MACD) indicators are firmly bearish on daily candlesticks, and the indicators are warning buyers that there could still be plenty of room to run towards the downside before a successful bullish offensive can be mounted.
USD/CAD daily chart
USD/CAD technical levels


© 2000-2026. Bản quyền Teletrade.
Trang web này được quản lý bởi Teletrade D.J. LLC 2351 LLC 2022 (Euro House, Richmond Hill Road, Kingstown, VC0100, St. Vincent and the Grenadines).
Thông tin trên trang web không phải là cơ sở để đưa ra quyết định đầu tư và chỉ được cung cấp cho mục đích làm quen.
Giao dịch trên thị trường tài chính (đặc biệt là giao dịch sử dụng các công cụ biên) mở ra những cơ hội lớn và tạo điều kiện cho các nhà đầu tư sẵn sàng mạo hiểm để thu lợi nhuận, tuy nhiên nó mang trong mình nguy cơ rủi ro khá cao. Chính vì vậy trước khi tiến hành giao dịch cần phải xem xét mọi mặt vấn đề chấp nhận tiến hành giao dịch cụ thể xét theo quan điểm của nguồn lực tài chính sẵn có và mức độ am hiểu thị trường tài chính.
Sử dụng thông tin: sử dụng toàn bộ hay riêng biệt các dữ liệu trên trang web của công ty TeleTrade như một nguồn cung cấp thông tin nhất định. Việc sử dụng tư liệu từ trang web cần kèm theo liên kết đến trang teletrade.vn. Việc tự động thu thập số liệu cũng như thông tin từ trang web TeleTrade đều không được phép.
Xin vui lòng liên hệ với pr@teletrade.global nếu có câu hỏi.
ngân hàng