- Phân tích
- Tin tức và các công cụ
- Tin tức thị trường
- USD/MXN Price Analysis: Manages to hold above 50-day SMA ahead of FOMC
USD/MXN Price Analysis: Manages to hold above 50-day SMA ahead of FOMC
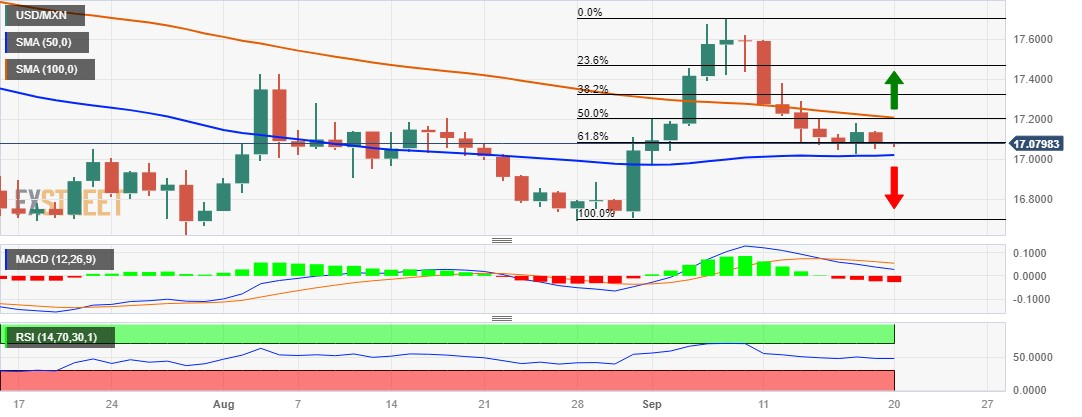
- USD/MXN oscillates in a range on Wednesday, around the 61.8% Fibo. level.
- The setup favours bears and supports prospects for some meaningful downfall.
- A move beyond the 17.20-25 confluence hurdle will negate the bearish outlook.
The USD/MXN remains on the defensive through the Asian session on Wednesday and is currently placed around the 17.0760-17.0755 area, representing the 61.8% Fibonacci retracement level of the rally from the August monthly swing low. Spot prices, however, manage to hold above a two-week low touched on Monday and the 50-day Simple Moving Average (SMA), pegged near the 17.0235 region, which should act as a key pivotal point ahead of the highly-anticipated FOMC monetary policy decision.
Oscillators on the daily chart, meanwhile, have been gaining negative traction and suggest that the path of least resistance for the USD/MXN pair is to the downside. That said, it will still be prudent to wait for a sustained break below the aforementioned support before positioning for further losses. Spot prices might then turn vulnerable to weaken further below the 17.0000 psychological mark and test the 16.8885 support zone. The downward trajectory could get extended further towards the multi-year trough, near the 16.6945 region touched in August.
On the flip side, the overnight swing high, around the 17.1420-17.1425 area now seems to act as an immediate hurdle ahead of the weekly top, near the 17.1825 region touched on Monday. Any subsequent move up is more likely to confront stiff resistance and remain capped near the 17.2060-17.2280 confluence, comprising the 50% Fibo. level and the 100-day SMA. Some follow-through buying, however, should lift the USD/MXN pair to the 38.2% Fibo. level, around the 17.3300 region en route to the 23.6% Fibo. barrier near the 17.4775 area.
The next relevant hurdle is pegged near the multi-month top, around the 17.7090-17.7095 zone, which if cleared decisively will be seen as a fresh trigger for bullish traders and set the stage for a further near-term appreciating move for the USD/MXN pair.
USD/MXN daily chart
Technical levels to watch


© 2000-2026. Bản quyền Teletrade.
Trang web này được quản lý bởi Teletrade D.J. LLC 2351 LLC 2022 (Euro House, Richmond Hill Road, Kingstown, VC0100, St. Vincent and the Grenadines).
Thông tin trên trang web không phải là cơ sở để đưa ra quyết định đầu tư và chỉ được cung cấp cho mục đích làm quen.
Giao dịch trên thị trường tài chính (đặc biệt là giao dịch sử dụng các công cụ biên) mở ra những cơ hội lớn và tạo điều kiện cho các nhà đầu tư sẵn sàng mạo hiểm để thu lợi nhuận, tuy nhiên nó mang trong mình nguy cơ rủi ro khá cao. Chính vì vậy trước khi tiến hành giao dịch cần phải xem xét mọi mặt vấn đề chấp nhận tiến hành giao dịch cụ thể xét theo quan điểm của nguồn lực tài chính sẵn có và mức độ am hiểu thị trường tài chính.
Sử dụng thông tin: sử dụng toàn bộ hay riêng biệt các dữ liệu trên trang web của công ty TeleTrade như một nguồn cung cấp thông tin nhất định. Việc sử dụng tư liệu từ trang web cần kèm theo liên kết đến trang teletrade.vn. Việc tự động thu thập số liệu cũng như thông tin từ trang web TeleTrade đều không được phép.
Xin vui lòng liên hệ với pr@teletrade.global nếu có câu hỏi.
ngân hàng