- Phân tích
- Tin tức và các công cụ
- Tin tức thị trường
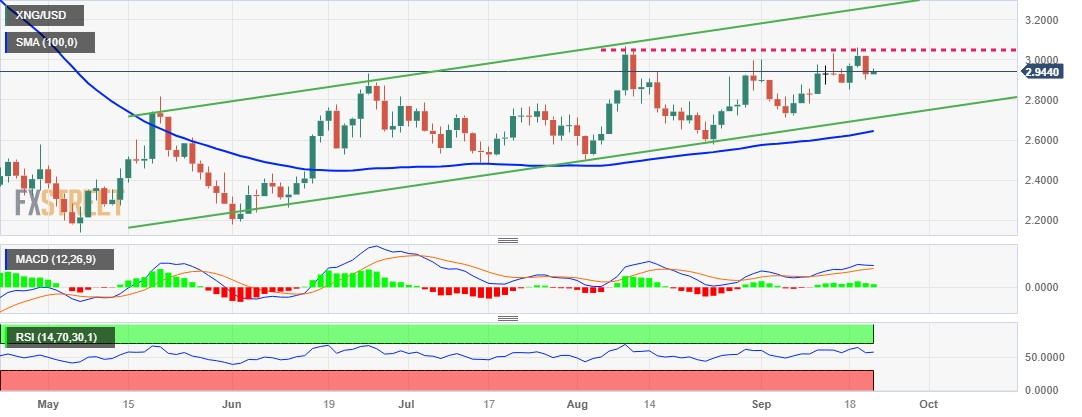
- Natural Gas Price Analysis: XNG/USD sticks to modest intraday gains, remains below $3.0000
Natural Gas Price Analysis: XNG/USD sticks to modest intraday gains, remains below $3.0000
- Natural Gas price attracts some dip-buying on Thursday and reverses a part of the overnight slide.
- The technical setup still seems tilted in favour of bulls and supports prospects for additional gains.
- A break below the ascending channel/100-day SMA confluence should negate the positive outlook.
Natural Gas price edges higher during the Asian session on Thursday and reverses a part of the previous day's heavy losses, though the intraday uptick lacks bullish conviction. The XNG/USD currently trades around the $2.9430 region, up over 0.50% for the day, and for now, seems to have stalled this week's retracement slide from the vicinity of a multi-month top touched in August.
From a technical perspective, the recent move-up witnessed over the past four months or so has been along an upward-sloping channel, which points to a well-established short-term uptrend. The subsequent breakout through and acceptance above the very important 200-day Simple Moving Average (SMA) favours bullish traders. This, along with the fact that oscillators on the daily chart are holding comfortably in the positive territory and are still far from being in the overbought zone, suggests that the path of least resistance for the XNG/USD pair is to the upside.
That said, a bullish rejection near the $3.0620 level, ahead of the August swing high, warrants some caution before positioning for additional gains. The overnight trough, around the $2.9000 area, however, might now protect the immediate downside ahead of the $2.8850 region and the weekly low, around the $2.8520 zone. The latter coincides with the 200-day SMA, which if broken will expose the monthly trough, around the $2.7150 area. The XNG/USD could drop further to test the ascending channel support near the $2.700 area and the 100-day SMA around $2.6500.
Some follow-through selling below the latter will suggest that the recovery from the $2.1780 area, or a multi-year low touched in June has run its course and shift the near-term bias back in favour of bearish traders.
On the flip side, any subsequent intraday move-up is likely to confront stiff resistance ahead of the $3.0000 psychological mark. The next relevant hurdle is pegged near the $3.0200 area, above which the XNG/USD could climb to challenge the $3.0620-$3.0650 supply zone. A sustained strength beyond should pave the way for a move towards testing the top boundary of the aforementioned trend-channel, currently pegged around the $3.2550 region.
XNG/USD daily chart


© 2000-2026. Bản quyền Teletrade.
Trang web này được quản lý bởi Teletrade D.J. LLC 2351 LLC 2022 (Euro House, Richmond Hill Road, Kingstown, VC0100, St. Vincent and the Grenadines).
Thông tin trên trang web không phải là cơ sở để đưa ra quyết định đầu tư và chỉ được cung cấp cho mục đích làm quen.
Giao dịch trên thị trường tài chính (đặc biệt là giao dịch sử dụng các công cụ biên) mở ra những cơ hội lớn và tạo điều kiện cho các nhà đầu tư sẵn sàng mạo hiểm để thu lợi nhuận, tuy nhiên nó mang trong mình nguy cơ rủi ro khá cao. Chính vì vậy trước khi tiến hành giao dịch cần phải xem xét mọi mặt vấn đề chấp nhận tiến hành giao dịch cụ thể xét theo quan điểm của nguồn lực tài chính sẵn có và mức độ am hiểu thị trường tài chính.
Sử dụng thông tin: sử dụng toàn bộ hay riêng biệt các dữ liệu trên trang web của công ty TeleTrade như một nguồn cung cấp thông tin nhất định. Việc sử dụng tư liệu từ trang web cần kèm theo liên kết đến trang teletrade.vn. Việc tự động thu thập số liệu cũng như thông tin từ trang web TeleTrade đều không được phép.
Xin vui lòng liên hệ với pr@teletrade.global nếu có câu hỏi.
ngân hàng