- Phân tích
- Tin tức và các công cụ
- Tin tức thị trường
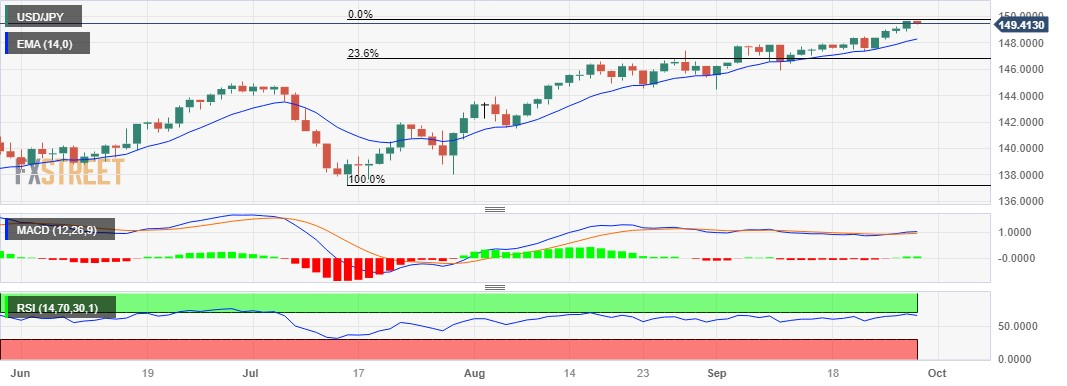
- USD/JPY Price Analysis: Pullbacks from 11-month high near 149.50
USD/JPY Price Analysis: Pullbacks from 11-month high near 149.50
- USD/JPY retreats with a positive bias, holding grounds below 149.50.
- Momentum indicators point toward a prevailing bullish sentiment in the market.
- The psychological level at 150.00 could emerge as a key resistance, following October’s high.
USD/JPY retreats with a positive bias from the highs since November, trading lower around 149.40 during the Asian session on Thursday. The pair is under pressure due to market caution about the US Federal Reserve’s (Fed) interest rate trajectory, coupled with higher US Treasury yields and economic data.
However, Japanese Finance Minister Shunichi Suzuki reaffirmed on Thursday that he is open to taking any necessary measures to address excessive foreign exchange (FX) market volatility. Suzuki also emphasizes that currencies move in a stable manner. The policymaker is closely watching FX moves with a sense of urgency, although declined to comment on any plans for a rate check.
The current upward momentum in USD/JPY appears to have a potential bullish bias, given that the 14-day Relative Strength Index (RSI) remains above the 50 level. However, there is a psychological resistance level at 150.00 that may pose a challenge for further gains.
If there's a strong breakthrough above the level, it could serve as an encouragement for USD/JPY bulls to explore higher levels, potentially targeting the area around the October high at 151.94.
On the flip side, the USD/JPY pair may encounter significant support levels in its price movement. The first notable support level could be around the 14-day Exponential Moving Average (EMA) at 148.27. Below that, there is the psychological support level at 148.00, which often holds significance in market dynamics.
If the pair breaks below the latter, it may then navigate towards the region around the psychological support level at 147.00, followed by the 23.6% Fibonacci retracement at 146.76.
The Moving Average Convergence Divergence (MACD) indicator is providing a bullish signal for the USD/JPY pair. The MACD line is positioned above both the centerline and the signal line. This configuration suggests that there is potentially strong momentum in the USD/JPY's price movement, indicating a prevailing bullish sentiment in the market.
USD/JPY: Daily Chart


© 2000-2026. Bản quyền Teletrade.
Trang web này được quản lý bởi Teletrade D.J. LLC 2351 LLC 2022 (Euro House, Richmond Hill Road, Kingstown, VC0100, St. Vincent and the Grenadines).
Thông tin trên trang web không phải là cơ sở để đưa ra quyết định đầu tư và chỉ được cung cấp cho mục đích làm quen.
Giao dịch trên thị trường tài chính (đặc biệt là giao dịch sử dụng các công cụ biên) mở ra những cơ hội lớn và tạo điều kiện cho các nhà đầu tư sẵn sàng mạo hiểm để thu lợi nhuận, tuy nhiên nó mang trong mình nguy cơ rủi ro khá cao. Chính vì vậy trước khi tiến hành giao dịch cần phải xem xét mọi mặt vấn đề chấp nhận tiến hành giao dịch cụ thể xét theo quan điểm của nguồn lực tài chính sẵn có và mức độ am hiểu thị trường tài chính.
Sử dụng thông tin: sử dụng toàn bộ hay riêng biệt các dữ liệu trên trang web của công ty TeleTrade như một nguồn cung cấp thông tin nhất định. Việc sử dụng tư liệu từ trang web cần kèm theo liên kết đến trang teletrade.vn. Việc tự động thu thập số liệu cũng như thông tin từ trang web TeleTrade đều không được phép.
Xin vui lòng liên hệ với pr@teletrade.global nếu có câu hỏi.
ngân hàng