- Phân tích
- Tin tức và các công cụ
- Tin tức thị trường
- DXY fails to hold momentum, declines near 106.00
DXY fails to hold momentum, declines near 106.00
- DXY initially rose to 106.60 and then settled near 106.05.
- Fed’s Logan words contributed to a significant increase in US bond yields.
- Focus shifts to FOMC minutes on Wednesday and Thursday’s inflation figures from the US.
In Monday’s session, the DXY index declined for a fourth consecutive day towards the 106.05 area after rising to a daily high of 106.60 earlier in the session. In line with that, the index continues consolidating the gains, which took it to a multi-month high of 107.35 last week, driven by high US Treasury yields and expectations of a more aggressive Federal Reserve (Fed).
Data-wise, investors are still assessing last Friday’s Nonfarm Payroll report, which saw job creation accelerating in September as well as the unemployment rate while wage inflation decelerated. Markets will now set their sight on Wednesday’s Federal Open Market Committee (FOMC) minutes of the September meeting and, on Thursday, the Consumer Price Index (CPI) figures from the US to continue modelling their expectations regarding the Fed’s next steps.
That being said, Lorie Logan from the Fed showed a dovish stance on Monday and stated that there may be “less need” for continuing hiking, which caused short-term US Treasury yields to decline to multi-week lows. In that sense, the US Dollar faced selling pressure, but hawkish clues on the FOMC minutes or hot inflation reading may reignite the Greenback’s momentum as the Fed has clearly stated that their stance is still data-dependant.
In addition, the escalation of the conflict between Israel and the Hamas terrorist group in the Middle East may boost demand for the USD as investors may take refuge in it.
DXY Levels to watch
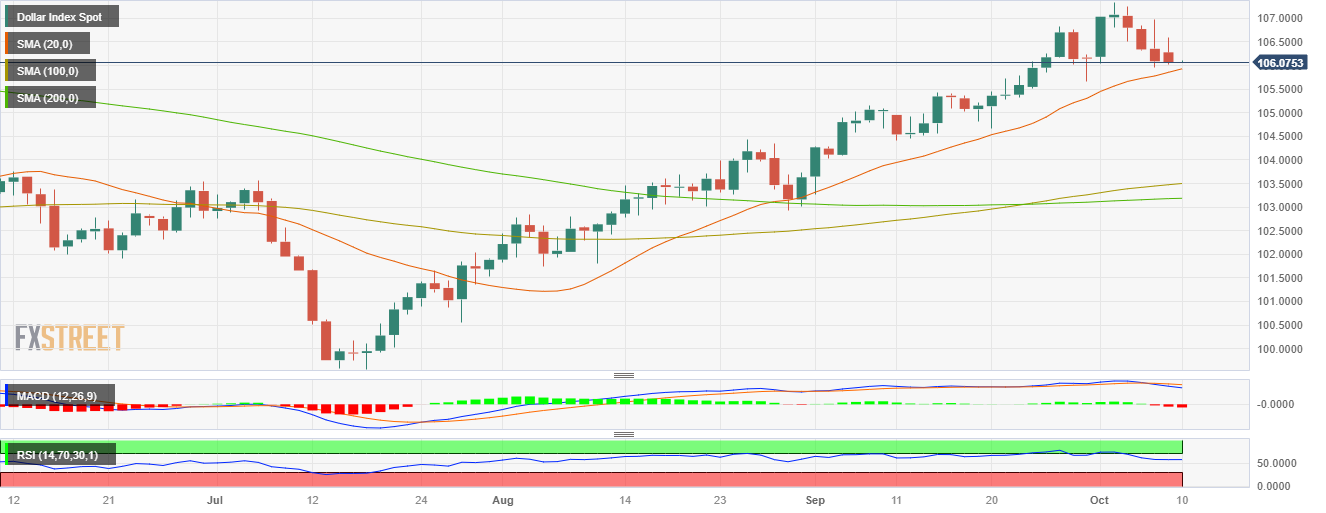
The daily chart analysis indicates a neutral to a bearish outlook for DXY, as the bears show signs of taking control but still face challenges ahead. The Relative Strength Index (RSI) exhibits a negative slope above its midline, while the Moving Average Convergence (MACD) histogram lays out larger red bars. That said, the index is above the 20,100,200-day Simple Moving Average (SMA), indicating buyers command the broader perspective.
Support levels: 106.00, 105.85 (20-day SMA), 105.50.
Resistance levels: 106.30, 107.00, 107.30.
DXY Daily Chart


© 2000-2026. Bản quyền Teletrade.
Trang web này được quản lý bởi Teletrade D.J. LLC 2351 LLC 2022 (Euro House, Richmond Hill Road, Kingstown, VC0100, St. Vincent and the Grenadines).
Thông tin trên trang web không phải là cơ sở để đưa ra quyết định đầu tư và chỉ được cung cấp cho mục đích làm quen.
Giao dịch trên thị trường tài chính (đặc biệt là giao dịch sử dụng các công cụ biên) mở ra những cơ hội lớn và tạo điều kiện cho các nhà đầu tư sẵn sàng mạo hiểm để thu lợi nhuận, tuy nhiên nó mang trong mình nguy cơ rủi ro khá cao. Chính vì vậy trước khi tiến hành giao dịch cần phải xem xét mọi mặt vấn đề chấp nhận tiến hành giao dịch cụ thể xét theo quan điểm của nguồn lực tài chính sẵn có và mức độ am hiểu thị trường tài chính.
Sử dụng thông tin: sử dụng toàn bộ hay riêng biệt các dữ liệu trên trang web của công ty TeleTrade như một nguồn cung cấp thông tin nhất định. Việc sử dụng tư liệu từ trang web cần kèm theo liên kết đến trang teletrade.vn. Việc tự động thu thập số liệu cũng như thông tin từ trang web TeleTrade đều không được phép.
Xin vui lòng liên hệ với pr@teletrade.global nếu có câu hỏi.
ngân hàng