- Phân tích
- Tin tức và các công cụ
- Tin tức thị trường
- USD/MXN Price Analysis: Bears flirt with 17.80 confluence resistance-turned-support
USD/MXN Price Analysis: Bears flirt with 17.80 confluence resistance-turned-support
- USD/MXN oscillates in a narrow trading band near a one-week trough touched on Wednesday.
- The mixed technical setup warrants caution for bears and before positioning for deeper losses.
- A sustained strngth beyond the 38.2% Fibo. level will set the stage for some maningful upside.
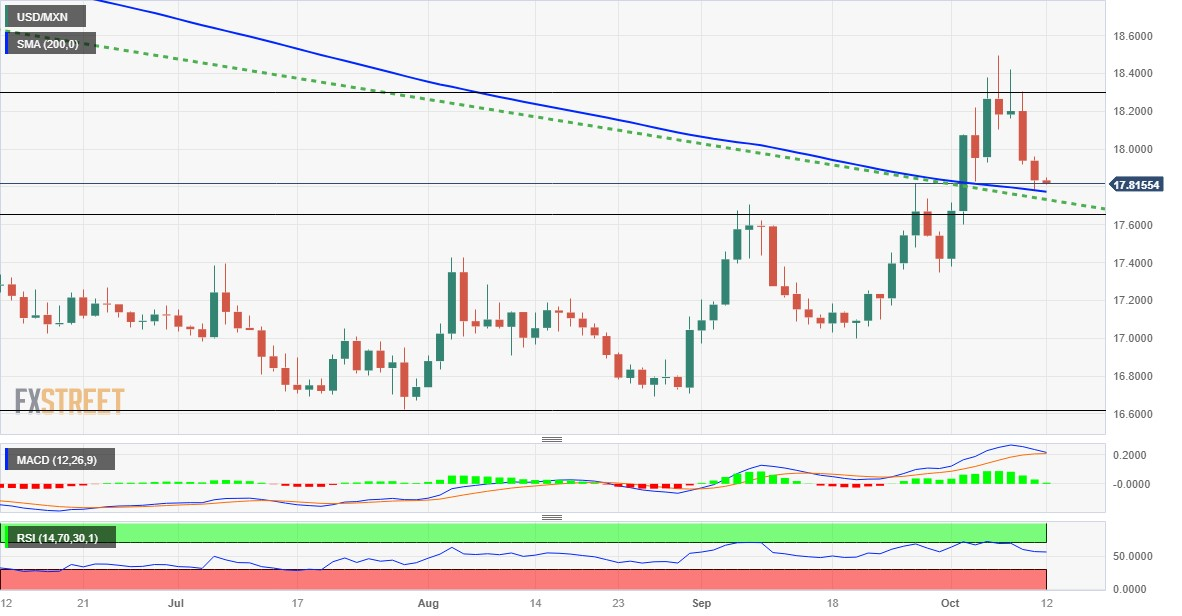
The USD/MXN pair trades on the backfoot during the Asian session on Wednesday and consolidates its recent losses to over a one-week low touched the previous day. Spot prices currently trade around the 17.80 region, down 0.10% for the day, flirting with a confluence resistance breakpoint comprising the 200-day Simple Moving Average (SMA) and a multi-month-old descending trend-line.
Meanwhile, technical indicators on the daily chart have been retreating from higher levels, though manage to hold in the positive territory. This makes it prudent to wait for a convincing break below the aforementioned resistance-turned-support before positioning for an extension of the recent pullback from mid-18.00s, or the highest level since late March touched last week. Some follow-through selling below the 17.65 zone, representing the 23.6% Fibonacci retracement level of the fall witnessed in July, will shift the near-term bias for the USD/MXN pair back in favour of bearish traders.
Spot prices might then accelerate the fall to the 17.40-17.35 horizontal support before dropping further towards the 17.15-17.10 intermediate support. The downward trajectory could get extended and drag the USD/MXN pair to the 16.90-16.85 area and the multi-year low, around the 16.65-16.60 region touched in July.
On the flip side, the 18.00 round figure now seems to act as an immediate hurdle ahead of the 18.15-18.20 zone. This is followed by 38.2% Fibo., around the 18.30 region and mid-18.00s, or the monthly. A sustained strength beyond will set the stage for the resumption of the recent appreciating move witnessed over the past month or so and lift the USD/MXN pair to the 18.80-18.85 area, representing 50% Fibo. level.
USD/MXN daily chart
Techincal levels to watch


© 2000-2026. Bản quyền Teletrade.
Trang web này được quản lý bởi Teletrade D.J. LLC 2351 LLC 2022 (Euro House, Richmond Hill Road, Kingstown, VC0100, St. Vincent and the Grenadines).
Thông tin trên trang web không phải là cơ sở để đưa ra quyết định đầu tư và chỉ được cung cấp cho mục đích làm quen.
Giao dịch trên thị trường tài chính (đặc biệt là giao dịch sử dụng các công cụ biên) mở ra những cơ hội lớn và tạo điều kiện cho các nhà đầu tư sẵn sàng mạo hiểm để thu lợi nhuận, tuy nhiên nó mang trong mình nguy cơ rủi ro khá cao. Chính vì vậy trước khi tiến hành giao dịch cần phải xem xét mọi mặt vấn đề chấp nhận tiến hành giao dịch cụ thể xét theo quan điểm của nguồn lực tài chính sẵn có và mức độ am hiểu thị trường tài chính.
Sử dụng thông tin: sử dụng toàn bộ hay riêng biệt các dữ liệu trên trang web của công ty TeleTrade như một nguồn cung cấp thông tin nhất định. Việc sử dụng tư liệu từ trang web cần kèm theo liên kết đến trang teletrade.vn. Việc tự động thu thập số liệu cũng như thông tin từ trang web TeleTrade đều không được phép.
Xin vui lòng liên hệ với pr@teletrade.global nếu có câu hỏi.
ngân hàng