- Phân tích
- Tin tức và các công cụ
- Tin tức thị trường
- USD/SGD declines below the 20-day SMA as the USD weakens
USD/SGD declines below the 20-day SMA as the USD weakens
- USD/SGD trades below 1.3700 with 0.20 daily losses.
- Inflation in Singapore came in slightly lower than expected.
- The US Dollar trades soft ahead of high-tier economic figures to be released this week.
The USD/SGD declined in Monday's session, mainly driven by the Greenback trading weak against its rivals amid dovish bets on the Federal Reserve (Fed) and lower US Treasury yields. The SGD managed to hold its foot despite lower-than-expected inflation data released during the Asian session, and the focus shifts to key economic activity figures from the US to be released during the week. The economic calendar had nothing relevant to offer on Monday.
The Consumer Price Index (CPI) from Singapore from September came in at 4.1% YoY, lower than the 4.2% YoY expected but accelerated from its last figure of 4.2% YoY.
On the US side, it trades softs as market speculations lean towards a less aggressive approach by the Federal Reserve (Fed) following Chair Powell's speech last week. In his address, Powell emphasised the need to consider the elevated bond yields and stressed the importance of cautious actions in the next decisions. In that sense, the CME FedWatch tool indicates minimal probabilities, currently at approximately 30%, for a 25 basis points hike in the December meeting, which has led to a decline in interest in the US dollar.
On the data front, the US will release the S&P Manufacturing PMI from October on Tuesday, followed by the Q3 Gross Domestic Product (GDP) on Thursday and the Core Personal Consumption Expenditures from September on Friday.
USD/SGD Levels to watch
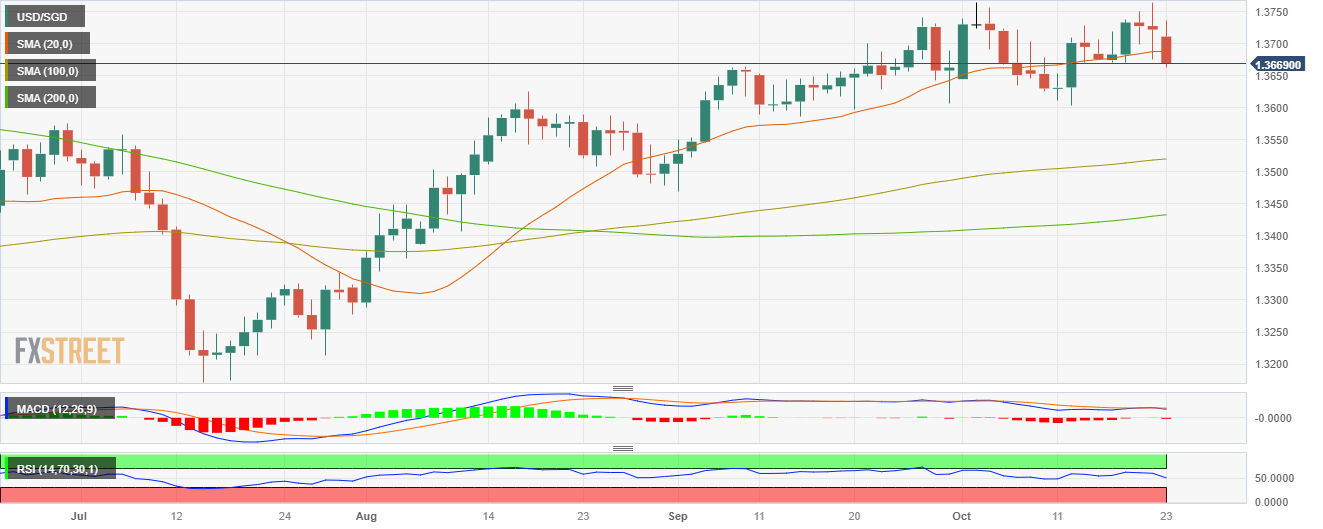
Analysing the daily chart, USD/SGD exhibits signs of bullish exhaustion, contributing to a neutral to bearish technical perspective. The Relative Strength Index (RSI) displays a negative slope in the bullish territory, hinting at a potential shift in momentum, while the Moving Average Convergence (MACD) shows flat green bars. However, the pair is above the 100 and 200-day Simple Moving Average (SMA), highlighting the continued dominance of bulls on the broader scale.
Support levels:1.3660, 1.3650, 1.3630.
Resistance levels: 1.3690 (20-day SMA), 1.3740, 1.3770, 1.3800.
USD/SGD Daily chart


© 2000-2026. Bản quyền Teletrade.
Trang web này được quản lý bởi Teletrade D.J. LLC 2351 LLC 2022 (Euro House, Richmond Hill Road, Kingstown, VC0100, St. Vincent and the Grenadines).
Thông tin trên trang web không phải là cơ sở để đưa ra quyết định đầu tư và chỉ được cung cấp cho mục đích làm quen.
Giao dịch trên thị trường tài chính (đặc biệt là giao dịch sử dụng các công cụ biên) mở ra những cơ hội lớn và tạo điều kiện cho các nhà đầu tư sẵn sàng mạo hiểm để thu lợi nhuận, tuy nhiên nó mang trong mình nguy cơ rủi ro khá cao. Chính vì vậy trước khi tiến hành giao dịch cần phải xem xét mọi mặt vấn đề chấp nhận tiến hành giao dịch cụ thể xét theo quan điểm của nguồn lực tài chính sẵn có và mức độ am hiểu thị trường tài chính.
Sử dụng thông tin: sử dụng toàn bộ hay riêng biệt các dữ liệu trên trang web của công ty TeleTrade như một nguồn cung cấp thông tin nhất định. Việc sử dụng tư liệu từ trang web cần kèm theo liên kết đến trang teletrade.vn. Việc tự động thu thập số liệu cũng như thông tin từ trang web TeleTrade đều không được phép.
Xin vui lòng liên hệ với pr@teletrade.global nếu có câu hỏi.
ngân hàng