- Phân tích
- Tin tức và các công cụ
- Tin tức thị trường
- NZD/USD rallies to multi-week highs after soft US NFPs
NZD/USD rallies to multi-week highs after soft US NFPs
- NZD/USD rose by more than 1% to 0.5990, its highest since mid October.
- The US reported weak NFPs, which triggered a sharp decline in US yields and hawkish bets on the Fed.
- Eyes on next week’s CPI figures from the US from October.
On Friday, the NZD/USD rallied, driven by the US Dollar facing notable selling pressure after the release of the soft labour market, which triggered a decline in US Treasury yields and hawkish bets on the Federal Reserve (Fed) for the December meeting. On the Kiwi’s side, no relevant data was released.
The latest data from the US Bureau of Labor Statistics delivered a blow to market expectations, with the Nonfarm Payrolls for October falling short of projections. The report revealed an addition of 150,000 jobs in the US economy, trailing the anticipated 180,000 and showing a slowdown from the revised prior figure of 297,000. Additionally, the Unemployment Rate for the same period rose to 3.9%, surpassing the projected 3.8%.
Moreover, the Average Hourly Earnings for October exhibited a sluggish monthly growth of 0.2% but managed to climb to 4.1% YoY, surpassing the expected 4% and outpacing the previous figure of 4.3%.
Simultaneously, the US Treasury yields continue to decline, with the 2-year rate hitting its lowest mark since early September at 4.83%. Correspondingly, the longer-term 5 and 10-year rates retreated to approximately 4.50% and 4.54%. Regarding the December meeting of the Fed, the CME FedWatch Tool shows that the probability of a 25 basis points hike in declined to a mere 9%, exacerbating the selling pressure on the Greenback.
For the next week, the US will report inflation rate figures from October, which investors will closely watch to continue modelling their expectations.
NZD/USD Levels to watch
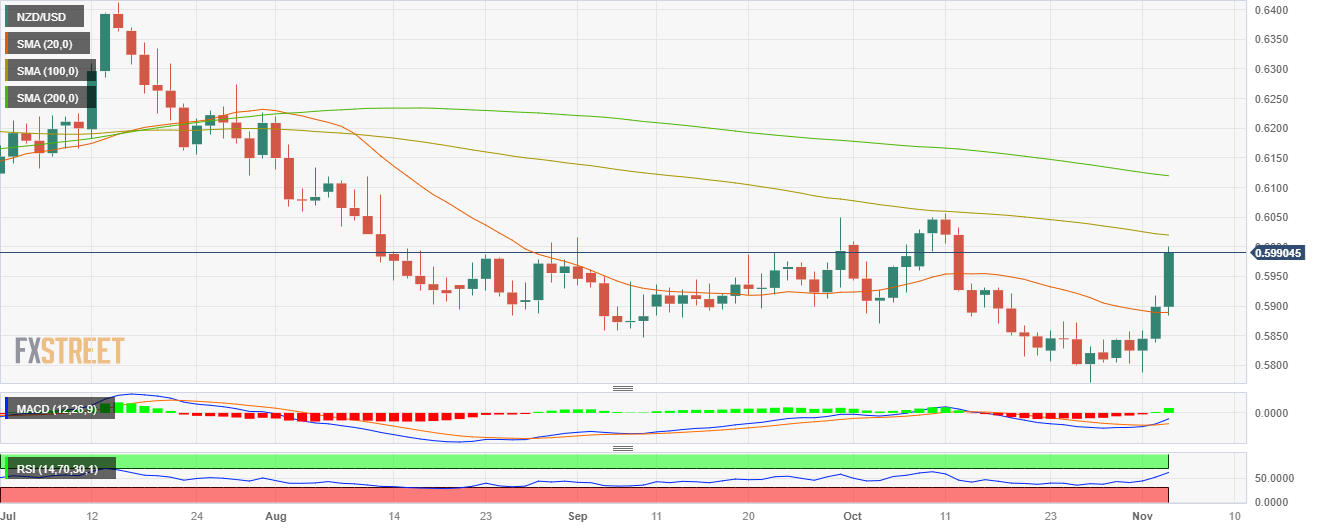
Based on the daily chart, NZD/USD maintains a neutral to bullish technical perspective, indicating that the bulls are making strides in regaining control and gathering significant momentum. The Relative Strength Index (RSI) maintains a positive slope above its midline, while the Moving Average Convergence (MACD) histogram exhibits bigger green bars.
However, despite being above the 20-day Simple Moving Average (SMA), the pair is still below the 100 and 200-day, indicating that on the broader outlook, the bears are in command.
Support levels: 0.5930, 0.5910, 0.5900.
Resistance levels: 0.6000, 0.6020 (100-day SMA), 0.6050.
NZD/USD Daily Chart


© 2000-2026. Bản quyền Teletrade.
Trang web này được quản lý bởi Teletrade D.J. LLC 2351 LLC 2022 (Euro House, Richmond Hill Road, Kingstown, VC0100, St. Vincent and the Grenadines).
Thông tin trên trang web không phải là cơ sở để đưa ra quyết định đầu tư và chỉ được cung cấp cho mục đích làm quen.
Giao dịch trên thị trường tài chính (đặc biệt là giao dịch sử dụng các công cụ biên) mở ra những cơ hội lớn và tạo điều kiện cho các nhà đầu tư sẵn sàng mạo hiểm để thu lợi nhuận, tuy nhiên nó mang trong mình nguy cơ rủi ro khá cao. Chính vì vậy trước khi tiến hành giao dịch cần phải xem xét mọi mặt vấn đề chấp nhận tiến hành giao dịch cụ thể xét theo quan điểm của nguồn lực tài chính sẵn có và mức độ am hiểu thị trường tài chính.
Sử dụng thông tin: sử dụng toàn bộ hay riêng biệt các dữ liệu trên trang web của công ty TeleTrade như một nguồn cung cấp thông tin nhất định. Việc sử dụng tư liệu từ trang web cần kèm theo liên kết đến trang teletrade.vn. Việc tự động thu thập số liệu cũng như thông tin từ trang web TeleTrade đều không được phép.
Xin vui lòng liên hệ với pr@teletrade.global nếu có câu hỏi.
ngân hàng