- Phân tích
- Tin tức và các công cụ
- Tin tức thị trường
- Silver Price Analysis: XAG/USD drifts lower in a multi-week-old trading range, below 200-day SMA
Silver Price Analysis: XAG/USD drifts lower in a multi-week-old trading range, below 200-day SMA
- Silver remains under some selling pressure for the second successive day on Tuesday.
- The formation of a rectangle points to indecision over the next leg of a directional move.
- The technical setup favours bearish traders and supports prospects for additional losses.
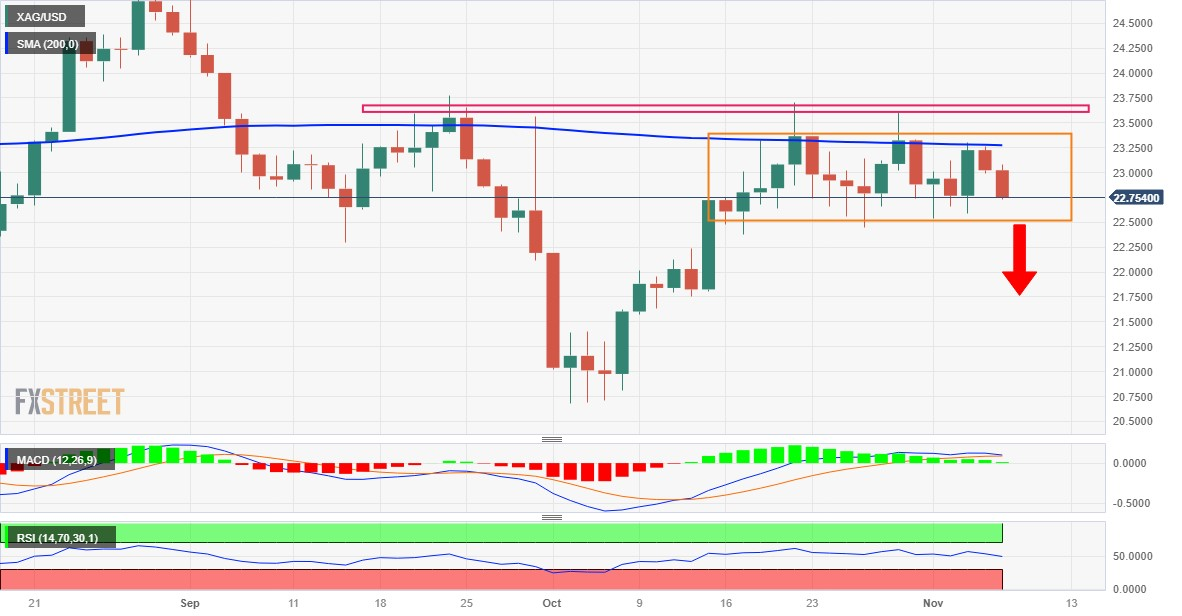
Silver (XAG/USD) extends the previous day's rejection slide from the very important 200-day Simple Moving Average (SMA) and continues losing ground for the second successive day on Tuesday. The downward trajectory picks up pace during the early part of the European session and drags the white metal to a two-day low, around the $22.75-$22.70 region in the last hour.
Looking at the broader picture, the XAG/USD has been oscillating in a familiar range over the past three weeks or so, forming a rectangle on the daily chart. This, in turn, points to indecision among traders over the next leg of a directional move. That said, the recent repeated failures to find acceptance above a technically significant 200-day SMA and rejections near the $23.60-$23.70 supply zone favour bearish traders.
Moreover, technical indicators on the daily chart have again started gaining negative traction, suggesting that the path of least resistance for the XAG/USD is to the downside. That said, it will still be prudent to wait for some follow-through selling below the $22.50 support zone before positioning for additional losses. The XAG/USD might then accelerate the fall to the $22.00 mark before dropping to the $21.70 horizontal support zone.
The downward trajectory could get extended further and drag the XAG/USD to the next relevant support near the $21.35-$21.30 region en route to the $21.00 mark. Bearish traders might then aim to challenge a seven-month low, around the $20.70-$20.65 area touched in October.
On the flip side, the $23.00 mark now seems to cap the immediate upside ahead of the 200-day SMA, currently pegged near the $23.25 region. This is followed by the $23.60-$23.70 supply zone, which should act as a key pivotal point for short-term traders. A sustained breakout through will negate the negative outlook and shift the near-term bias in favour of bullish traders, paving the way for a move towards the $24.00 mark.
Some follow-through buying has the potential to lift the XAG/USD beyond the $24.20-$24.25 intermediate resistance and make a fresh attempt to conquer the $25.00 psychological mark.
Silver daily chart
Technical levels to watch


© 2000-2026. Bản quyền Teletrade.
Trang web này được quản lý bởi Teletrade D.J. LLC 2351 LLC 2022 (Euro House, Richmond Hill Road, Kingstown, VC0100, St. Vincent and the Grenadines).
Thông tin trên trang web không phải là cơ sở để đưa ra quyết định đầu tư và chỉ được cung cấp cho mục đích làm quen.
Giao dịch trên thị trường tài chính (đặc biệt là giao dịch sử dụng các công cụ biên) mở ra những cơ hội lớn và tạo điều kiện cho các nhà đầu tư sẵn sàng mạo hiểm để thu lợi nhuận, tuy nhiên nó mang trong mình nguy cơ rủi ro khá cao. Chính vì vậy trước khi tiến hành giao dịch cần phải xem xét mọi mặt vấn đề chấp nhận tiến hành giao dịch cụ thể xét theo quan điểm của nguồn lực tài chính sẵn có và mức độ am hiểu thị trường tài chính.
Sử dụng thông tin: sử dụng toàn bộ hay riêng biệt các dữ liệu trên trang web của công ty TeleTrade như một nguồn cung cấp thông tin nhất định. Việc sử dụng tư liệu từ trang web cần kèm theo liên kết đến trang teletrade.vn. Việc tự động thu thập số liệu cũng như thông tin từ trang web TeleTrade đều không được phép.
Xin vui lòng liên hệ với pr@teletrade.global nếu có câu hỏi.
ngân hàng