- Phân tích
- Tin tức và các công cụ
- Tin tức thị trường
- AUD/JPY Price Analysis: Gains momentum below the 99.00 mark amid the overbought condition
AUD/JPY Price Analysis: Gains momentum below the 99.00 mark amid the overbought condition
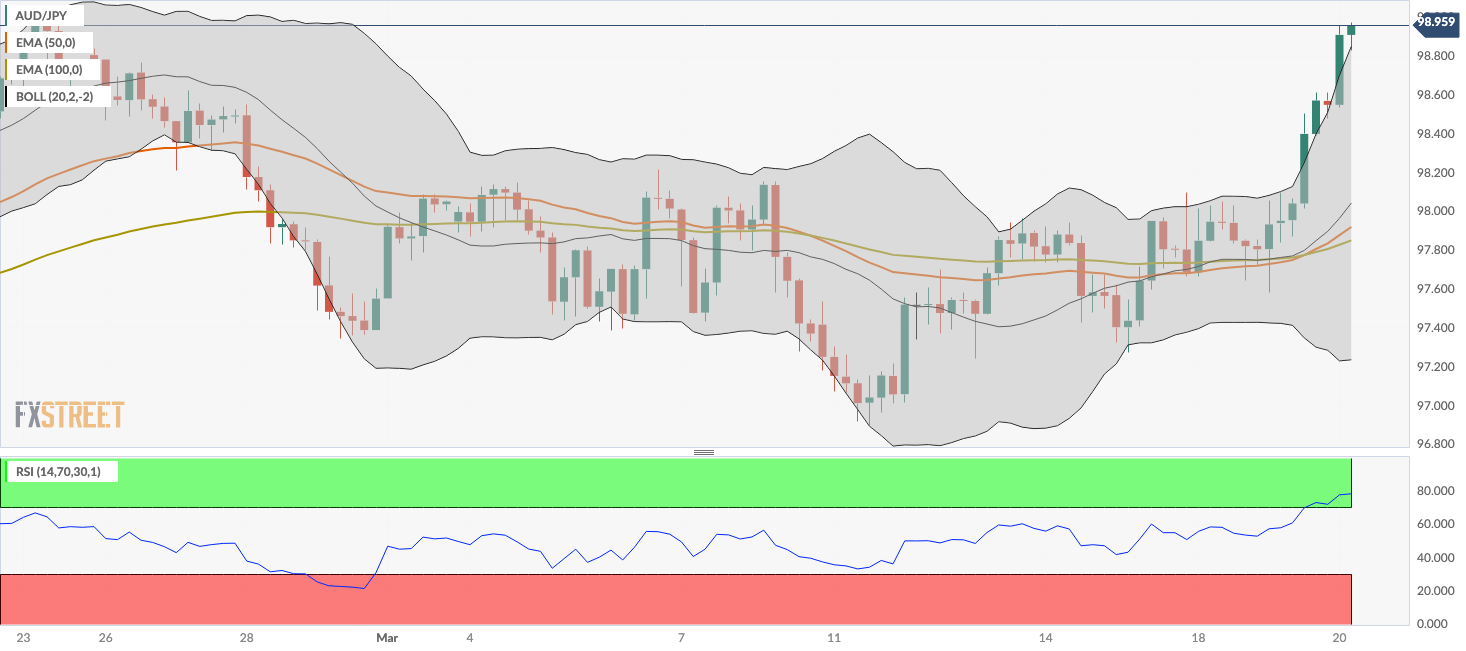
- AUD/JPY attracts some buyers around 98.95 in Wednesday’s early European session.
- The cross resumes its bullish outlook with the overbought RSI condition.
- The first upside barrier is located in the 99.00–99.05 region; 98.10 acts as an initial support level.
The AUD/JPY cross gains traction below the 99.00 psychological barrier during the early European trading hours on Wednesday. The decline of the Japanese Yen (JPY) to a multi-month low following the Bank of Japan’s (BoJ) dovish hike on Tuesday creates a tailwind for the cross. At the press time, the cross is trading at 98.95, up 0.43% on the day.
Technically, AUD/JPY keeps the bullish vibe unchanged as the cross is above the key 100-period Exponential Moving Averages (EMAs) on the four-hour chart. The Relative Strength Index (RSI) holds in bullish territory above the 50 midline. However, the overbought RSI condition indicates that further consolidation cannot be ruled out before positioning for any near-term AUD/JPY appreciation.
The first upside barrier for the cross will emerge at the 99.00–99.05 zone, representing a high of February 23 and a round figure. The key hurdle is seen at the psychological round mark of 100.00. Further north, the next upstate target is located near a weekly low of May 10, 2013 at 100.40.
On the other hand, a high of March 17 at 98.10 acts as an initial support level for AUD/JPY. The next contention level to watch is the 100-period EMA at 97.85. Any follow-through selling below the latter will resume the downside and drag the cross lower to a low of March 18 at 97.65, followed by the lower limit of the Bollinger Band at 97.24.
AUD/JPY four-hour chart


© 2000-2026. Bản quyền Teletrade.
Trang web này được quản lý bởi Teletrade D.J. LLC 2351 LLC 2022 (Euro House, Richmond Hill Road, Kingstown, VC0100, St. Vincent and the Grenadines).
Thông tin trên trang web không phải là cơ sở để đưa ra quyết định đầu tư và chỉ được cung cấp cho mục đích làm quen.
Giao dịch trên thị trường tài chính (đặc biệt là giao dịch sử dụng các công cụ biên) mở ra những cơ hội lớn và tạo điều kiện cho các nhà đầu tư sẵn sàng mạo hiểm để thu lợi nhuận, tuy nhiên nó mang trong mình nguy cơ rủi ro khá cao. Chính vì vậy trước khi tiến hành giao dịch cần phải xem xét mọi mặt vấn đề chấp nhận tiến hành giao dịch cụ thể xét theo quan điểm của nguồn lực tài chính sẵn có và mức độ am hiểu thị trường tài chính.
Sử dụng thông tin: sử dụng toàn bộ hay riêng biệt các dữ liệu trên trang web của công ty TeleTrade như một nguồn cung cấp thông tin nhất định. Việc sử dụng tư liệu từ trang web cần kèm theo liên kết đến trang teletrade.vn. Việc tự động thu thập số liệu cũng như thông tin từ trang web TeleTrade đều không được phép.
Xin vui lòng liên hệ với pr@teletrade.global nếu có câu hỏi.
ngân hàng