- Phân tích
- Tin tức và các công cụ
- Tin tức thị trường
- AUD/USD Price Analysis: Bearish momentum holds steady, bulls remain weak
AUD/USD Price Analysis: Bearish momentum holds steady, bulls remain weak
- The daily RSI reveals a potential increase in bearish momentum if the index remains below 50.
- Under key SMAs on the daily chart, the pair signals rising selling traction, requiring buyers to recover these significant levels.
- After the intense losses on Friday, indicators are consolidating in negative territory.
In Tuesday's session, the AUD/USD observed slight bearish momentum, declining towards 0.6535. The broader outlook reveals that the bears exhibit a somewhat stronger presence, which could maintain a certain level of pressure on the pair. Bears seem to have taken a breather after declining by nearly 0.84% last Friday, but the outlook is still tilted to the short-term downside.
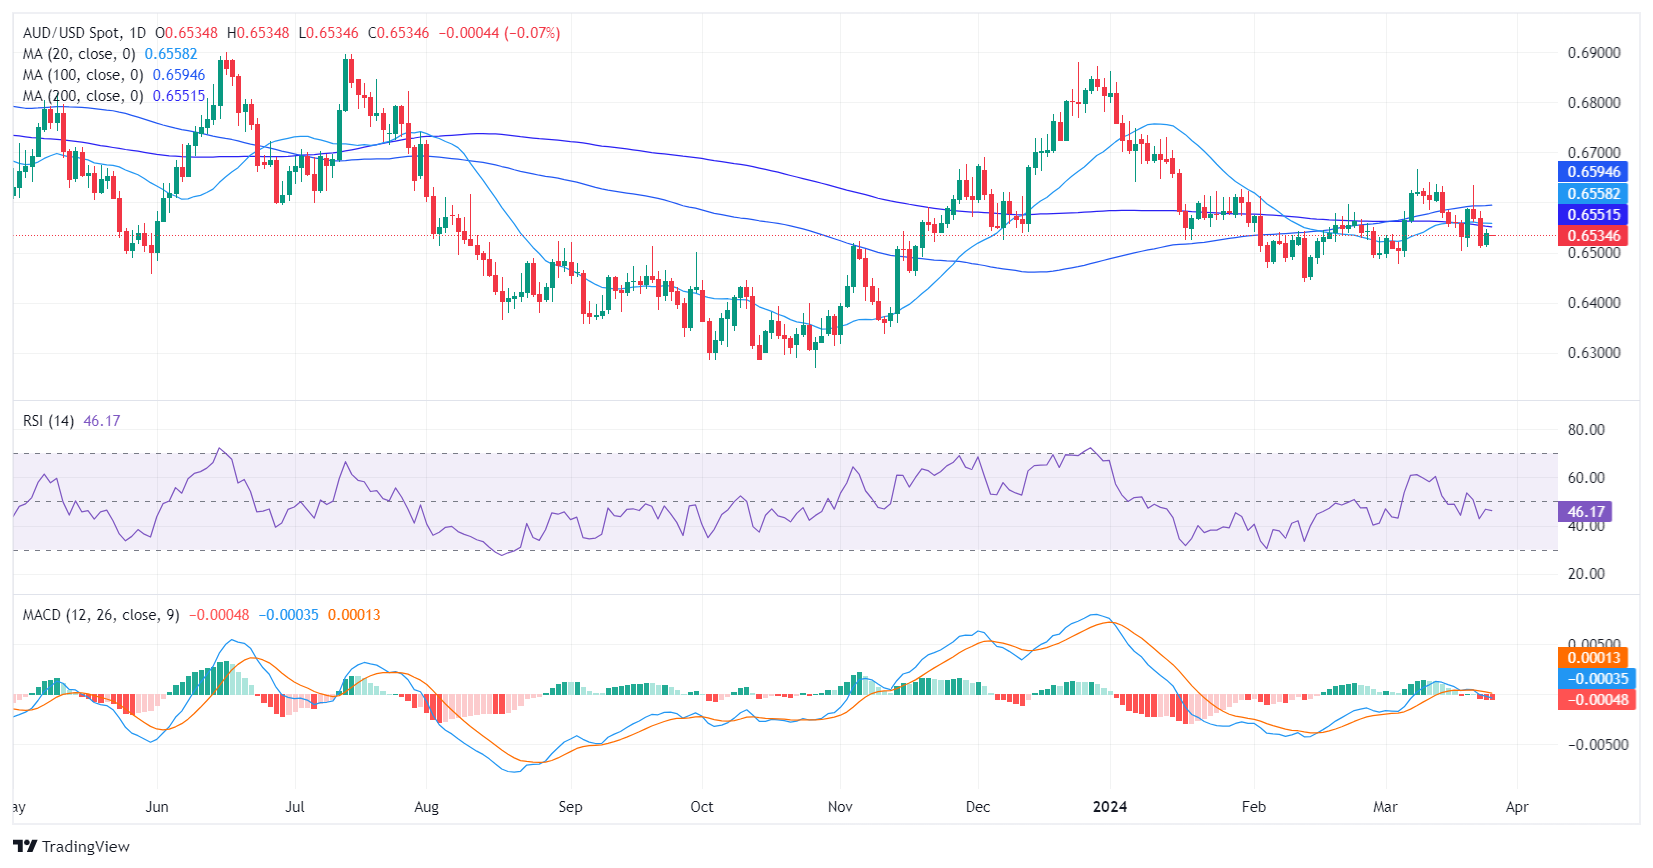
The Relative Strength Index (RSI) presents a negative landscape on the daily chart. The indicator resides in the negative territory with the latest reading just shy of 47. Although currently avoiding oversold conditions, the slight decline in the index is noticeable indicating a continuation of the bearish momentum if the RSI persists below 50. The Moving Average Convergence Divergence (MACD) lays out rising red bars which tends to suggest a mounting selling pressure.
AUD/USD daily chart
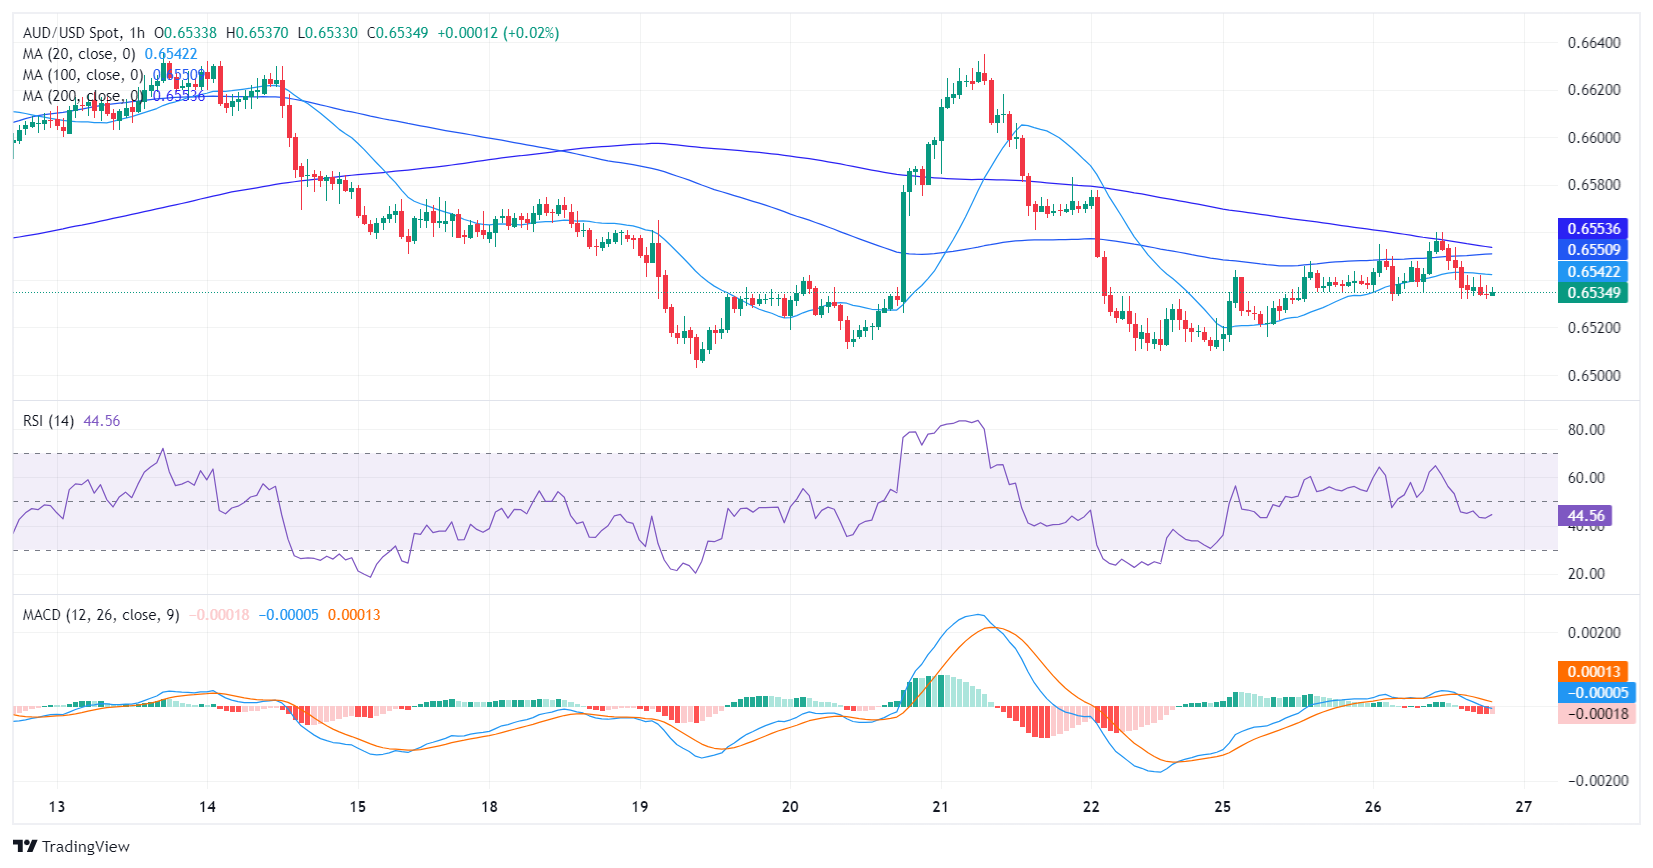
Turning the attention to an intraday perspective, the hourly chart reveals a similar trajectory but on a tighter scale. The hourly RSI has just dipped below 45, reinforcing a stronger bearish undertone into the most recent session. The MACD histogram further supports this outlook, with its red bars indicating the presence of negative momentum.
AUD/USD hourly chart
Surveying the larger context, the pair is below the 20, 100, and 200-day Simple Moving Averages (SMAs) which is a typical signal that the sellers are in control following last Friday’s losses. Overall, indicators seem to have consolidated in negative territory and might continue sideways trading while markets await fresh drivers. In the meantime, bears hold in command.


© 2000-2026. Bản quyền Teletrade.
Trang web này được quản lý bởi Teletrade D.J. LLC 2351 LLC 2022 (Euro House, Richmond Hill Road, Kingstown, VC0100, St. Vincent and the Grenadines).
Thông tin trên trang web không phải là cơ sở để đưa ra quyết định đầu tư và chỉ được cung cấp cho mục đích làm quen.
Giao dịch trên thị trường tài chính (đặc biệt là giao dịch sử dụng các công cụ biên) mở ra những cơ hội lớn và tạo điều kiện cho các nhà đầu tư sẵn sàng mạo hiểm để thu lợi nhuận, tuy nhiên nó mang trong mình nguy cơ rủi ro khá cao. Chính vì vậy trước khi tiến hành giao dịch cần phải xem xét mọi mặt vấn đề chấp nhận tiến hành giao dịch cụ thể xét theo quan điểm của nguồn lực tài chính sẵn có và mức độ am hiểu thị trường tài chính.
Sử dụng thông tin: sử dụng toàn bộ hay riêng biệt các dữ liệu trên trang web của công ty TeleTrade như một nguồn cung cấp thông tin nhất định. Việc sử dụng tư liệu từ trang web cần kèm theo liên kết đến trang teletrade.vn. Việc tự động thu thập số liệu cũng như thông tin từ trang web TeleTrade đều không được phép.
Xin vui lòng liên hệ với pr@teletrade.global nếu có câu hỏi.
ngân hàng