- Phân tích
- Tin tức và các công cụ
- Tin tức thị trường
- GBP/USD Price Analysis: Could test the level of 1.2600, next support at March’s low
GBP/USD Price Analysis: Could test the level of 1.2600, next support at March’s low
- GBP/USD could break the psychological support of the 1.2600 level to revisit March’s low at 1.2575.
- Technical analysis suggests the bearish sentiment to test the major support of the 1.2550 level.
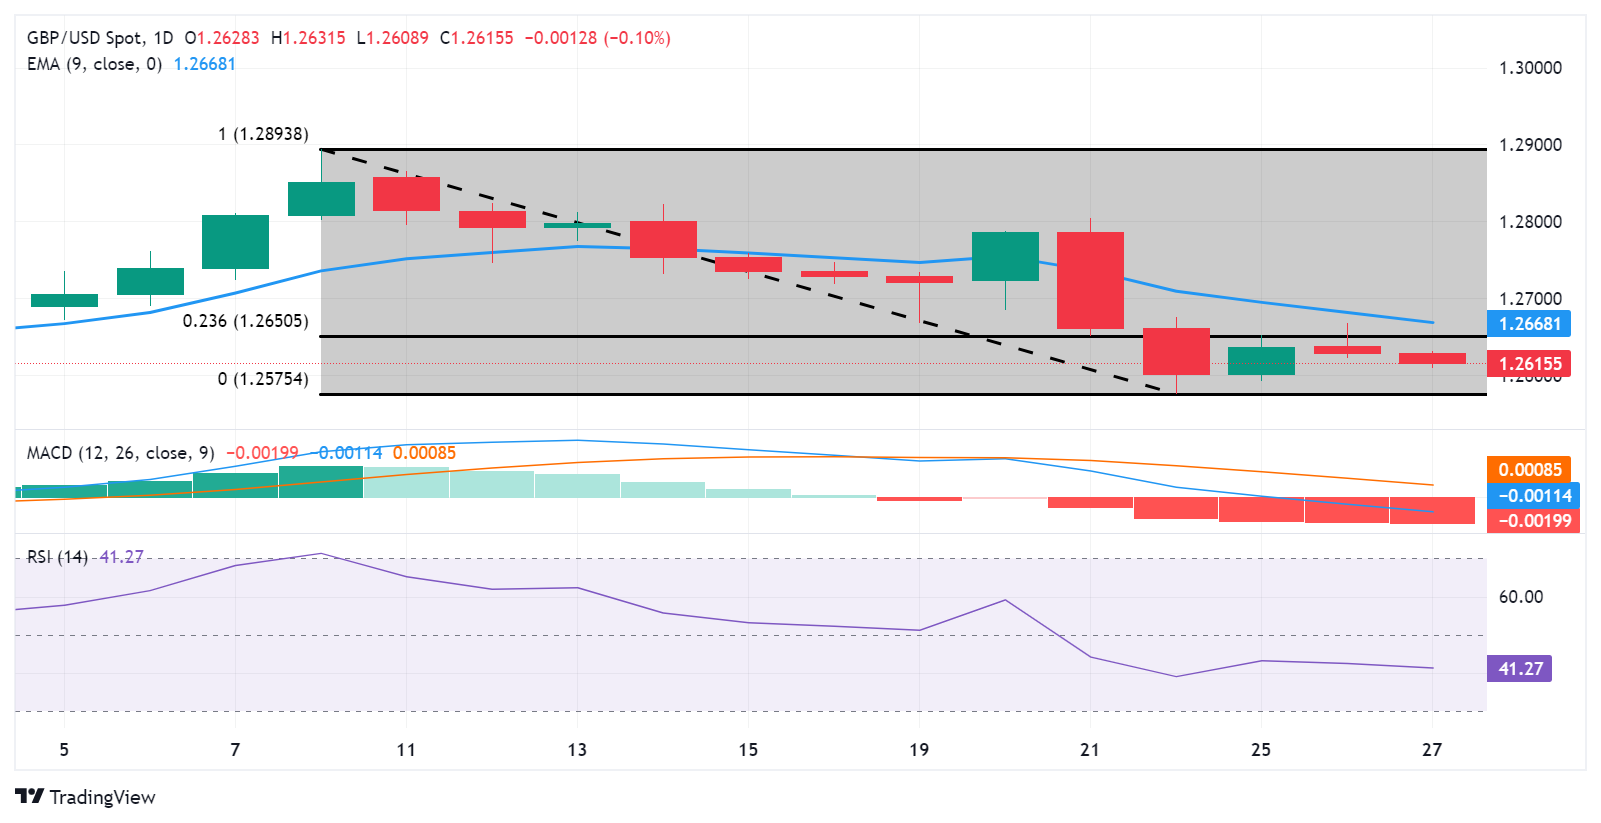
- The resistance zone could be found around the 23.6% Fibonacci retracement level of 1.2650 level and the nine-day EMA at 1.2668.
GBP/USD extends its losses for the second consecutive day, depreciating to near 1.2620 during the Asian session on Wednesday. The pair could test the psychological support level of 1.2600. If this level is breached, it could prompt the pair to revisit March’s low at 1.2575.
The technical analysis of the GBP/USD pair suggests a bearish trend. The 14-day Relative Strength Index (RSI) is positioned below 50, indicating a bearish sentiment. Additionally, the Moving Average Convergence Divergence (MACD) confirms the bearish trend, as the MACD line is below the centerline and exhibits divergence below the signal line.
The bearish sentiment could influence the GBP/USD pair to test the major support of 1.2550 level, followed by February’s low of 1.2518.
On the upside, the GBP/USD pair could meet the major barrier at 23.6% Fibonacci retracement level of 1.2650 level. A breakthrough above this barrier could exert upward support for the pair to test the nine-day Exponential Moving Average (EMA) at 1.2668.
If the GBP/USD pair surpasses the latter, it could approach the psychological level of 1.2700.
GBP/USD: Daily Chart


© 2000-2026. Bản quyền Teletrade.
Trang web này được quản lý bởi Teletrade D.J. LLC 2351 LLC 2022 (Euro House, Richmond Hill Road, Kingstown, VC0100, St. Vincent and the Grenadines).
Thông tin trên trang web không phải là cơ sở để đưa ra quyết định đầu tư và chỉ được cung cấp cho mục đích làm quen.
Giao dịch trên thị trường tài chính (đặc biệt là giao dịch sử dụng các công cụ biên) mở ra những cơ hội lớn và tạo điều kiện cho các nhà đầu tư sẵn sàng mạo hiểm để thu lợi nhuận, tuy nhiên nó mang trong mình nguy cơ rủi ro khá cao. Chính vì vậy trước khi tiến hành giao dịch cần phải xem xét mọi mặt vấn đề chấp nhận tiến hành giao dịch cụ thể xét theo quan điểm của nguồn lực tài chính sẵn có và mức độ am hiểu thị trường tài chính.
Sử dụng thông tin: sử dụng toàn bộ hay riêng biệt các dữ liệu trên trang web của công ty TeleTrade như một nguồn cung cấp thông tin nhất định. Việc sử dụng tư liệu từ trang web cần kèm theo liên kết đến trang teletrade.vn. Việc tự động thu thập số liệu cũng như thông tin từ trang web TeleTrade đều không được phép.
Xin vui lòng liên hệ với pr@teletrade.global nếu có câu hỏi.
ngân hàng