- Phân tích
- Tin tức và các công cụ
- Tin tức thị trường
- Silver Price Analysis: XAG/USD languishes near two-week low, seems vulnerable to slide further
Silver Price Analysis: XAG/USD languishes near two-week low, seems vulnerable to slide further
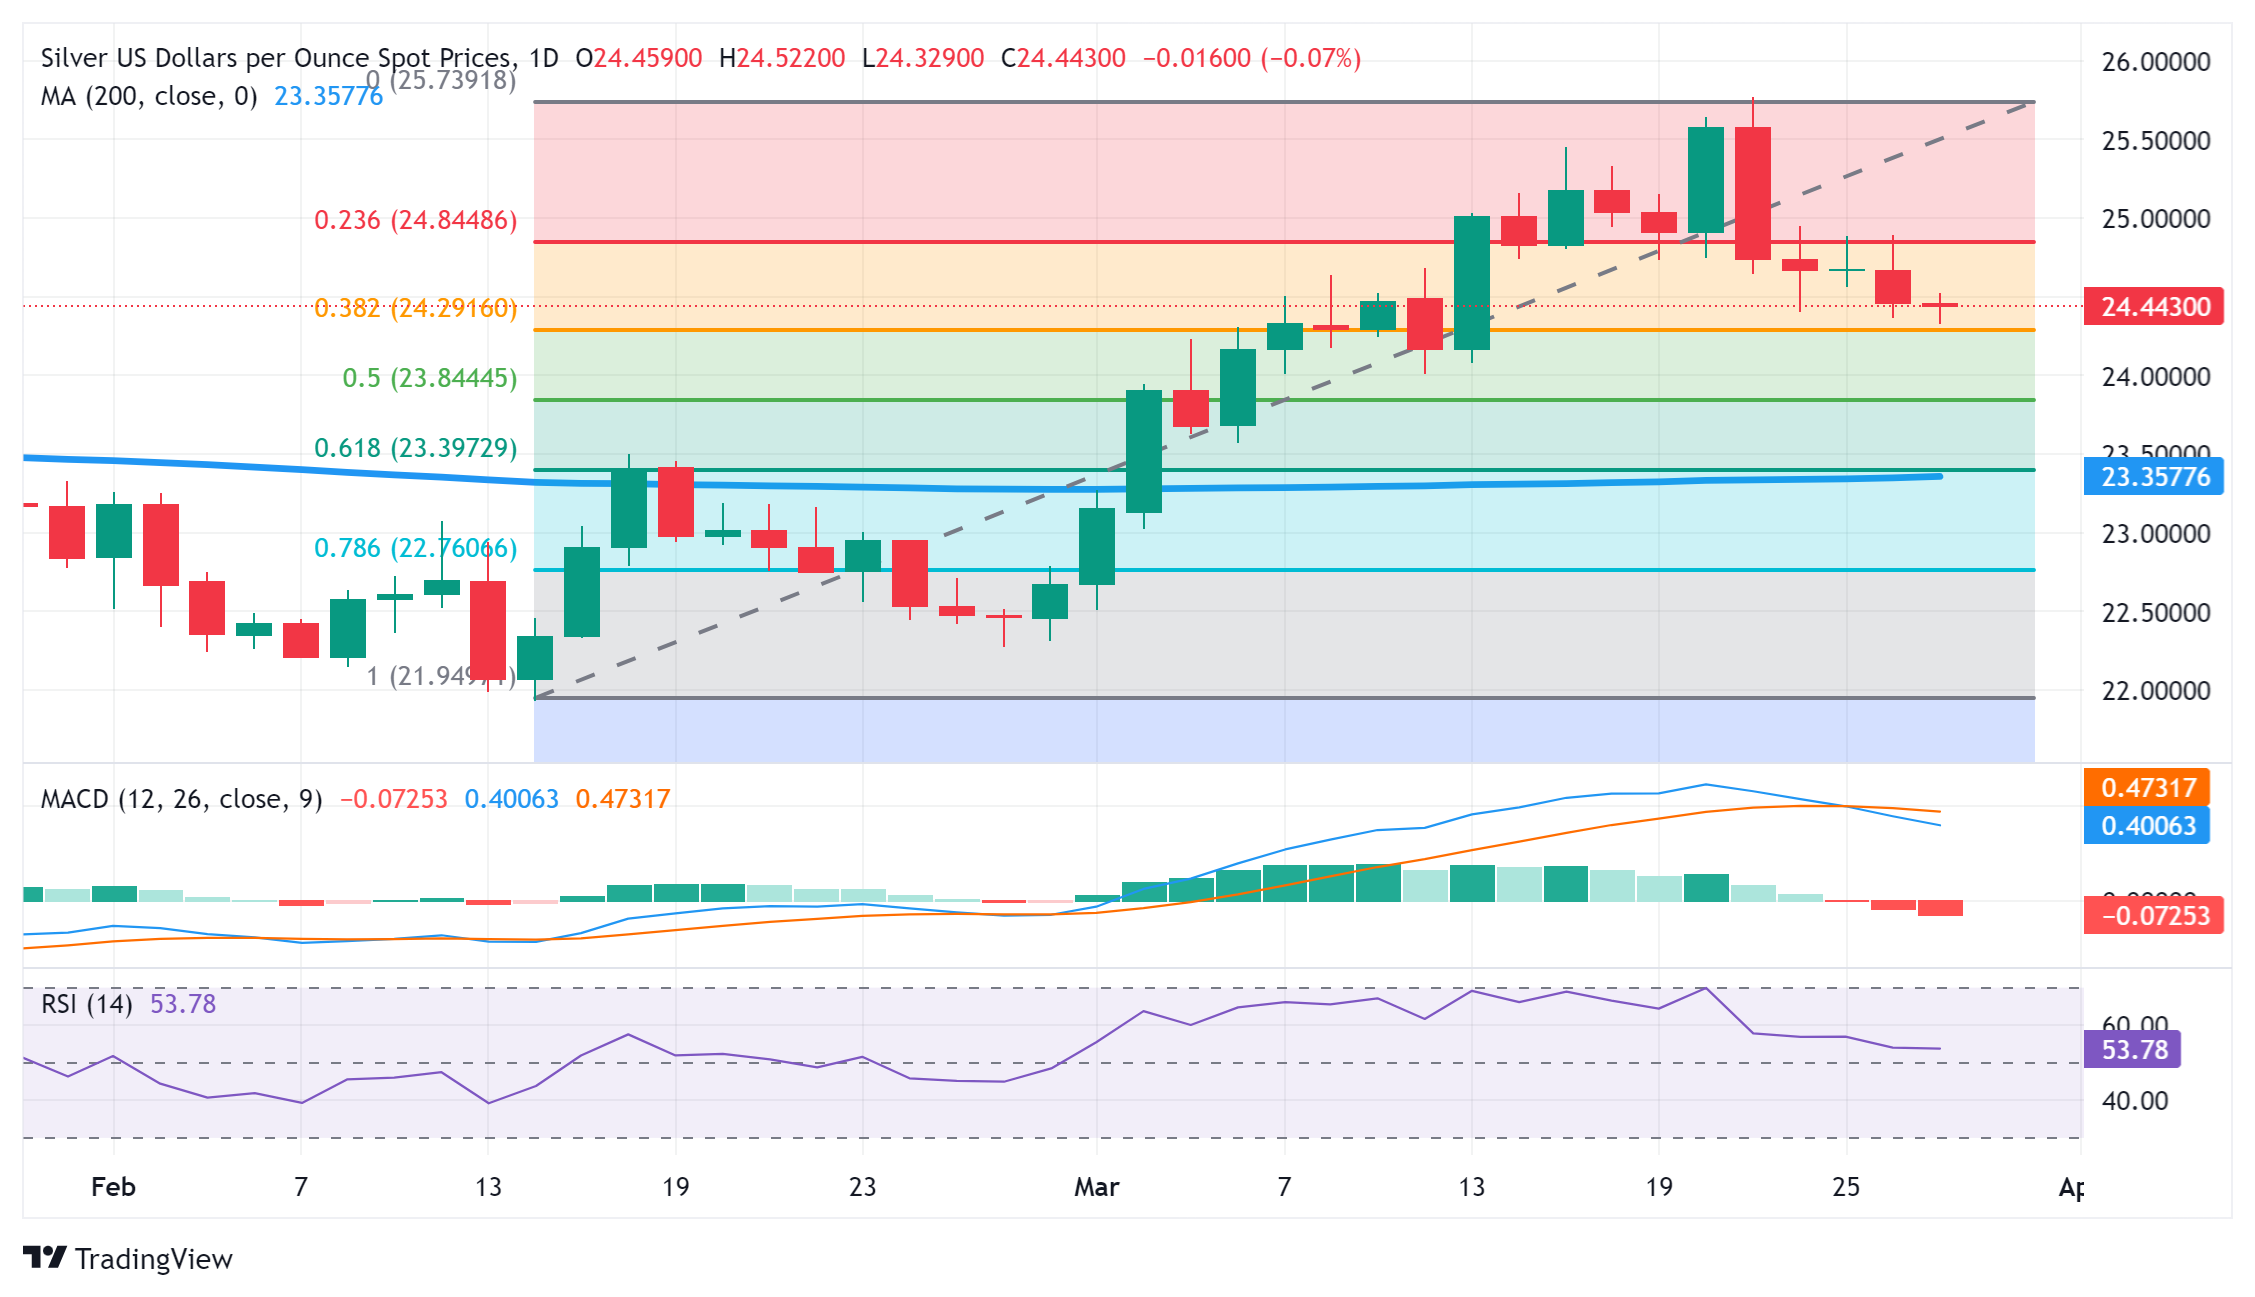
- Silver drops to a two-week low on Wednesday, albeit manages to hold above the 38.2% Fibo.
- The mixed technical setup warrants some caution before positioning for any further downfall.
- Any attempted recovery might confront a stiff barrier and remain capped near the $25.00 mark.
Silver (XAG/USD) oscillates in a narrow trading band through the first half of the European session and consolidates its recent losses to a two-week low touched earlier this Wednesday. The white metal currently trades just below the mid-$24.00s and seems vulnerable to prolonging its recent pullback from the YTD peak touched last week.
That said, mixed technical indicators on the daily chart and failure to break through the 38.2% Fibonacci retracement level of the February-March rally, warrant some caution for aggressive bearish traders. Hence, it will be prudent to wait for some follow-through selling below the $24.30 support zone before positioning for a further depreciating move. The XAG/USD might then weaken further below the $24.00 round-figure mark and test the 50% Fibo. level near the $23.85 zone.
The subsequent downfall has the potential to drag the white metal to the $23.40 confluence, comprising the 61.8% Fibo. and the very important 200-day Simple Moving Average (SMA), en route to the $23.00 round-figure mark. Failure to defend the latter might expose the next relevant support near the $22.45 region.
On the flip side, any attempted recovery is likely to attract fresh sellers and remain capped near the $25.00 psychological mark. That said, a sustained strength beyond the said handle might trigger a bout of a short-covering rally and lift the XAG/USD to the $25.50 region en route to the YTD peak, around the $25.75-$25.80 region. This is followed by the December 2023 swing high, just ahead of the $26.00 round figure, which if cleared will set the stage for additional near-term gains.
Silver daily chart


© 2000-2026. Bản quyền Teletrade.
Trang web này được quản lý bởi Teletrade D.J. LLC 2351 LLC 2022 (Euro House, Richmond Hill Road, Kingstown, VC0100, St. Vincent and the Grenadines).
Thông tin trên trang web không phải là cơ sở để đưa ra quyết định đầu tư và chỉ được cung cấp cho mục đích làm quen.
Giao dịch trên thị trường tài chính (đặc biệt là giao dịch sử dụng các công cụ biên) mở ra những cơ hội lớn và tạo điều kiện cho các nhà đầu tư sẵn sàng mạo hiểm để thu lợi nhuận, tuy nhiên nó mang trong mình nguy cơ rủi ro khá cao. Chính vì vậy trước khi tiến hành giao dịch cần phải xem xét mọi mặt vấn đề chấp nhận tiến hành giao dịch cụ thể xét theo quan điểm của nguồn lực tài chính sẵn có và mức độ am hiểu thị trường tài chính.
Sử dụng thông tin: sử dụng toàn bộ hay riêng biệt các dữ liệu trên trang web của công ty TeleTrade như một nguồn cung cấp thông tin nhất định. Việc sử dụng tư liệu từ trang web cần kèm theo liên kết đến trang teletrade.vn. Việc tự động thu thập số liệu cũng như thông tin từ trang web TeleTrade đều không được phép.
Xin vui lòng liên hệ với pr@teletrade.global nếu có câu hỏi.
ngân hàng