- Phân tích
- Tin tức và các công cụ
- Tin tức thị trường
- NZD/JPY Price Analysis: Bearish forces at play, bulls continue strugguling
NZD/JPY Price Analysis: Bearish forces at play, bulls continue strugguling
- The NZD/JPY trades neutral after getting rejected by the 20-day SMA.
- The daily chart shows that the RSI reveals weak buying traction.
- The hourly chart also showcases a similar situation with its RSI hinting at weak buying pressure.
The NZD/JPY is currently trading at 90.90, mostly neutral after trimming daily gains. From a broader perspective, the pair's position above the 100 and 200-day Simple Moving Averages (SMAs) suggests that despite the weakened buying momentum, the bulls continue to assert their control. Buyers must target the 20-day SMA to continue edging higher.
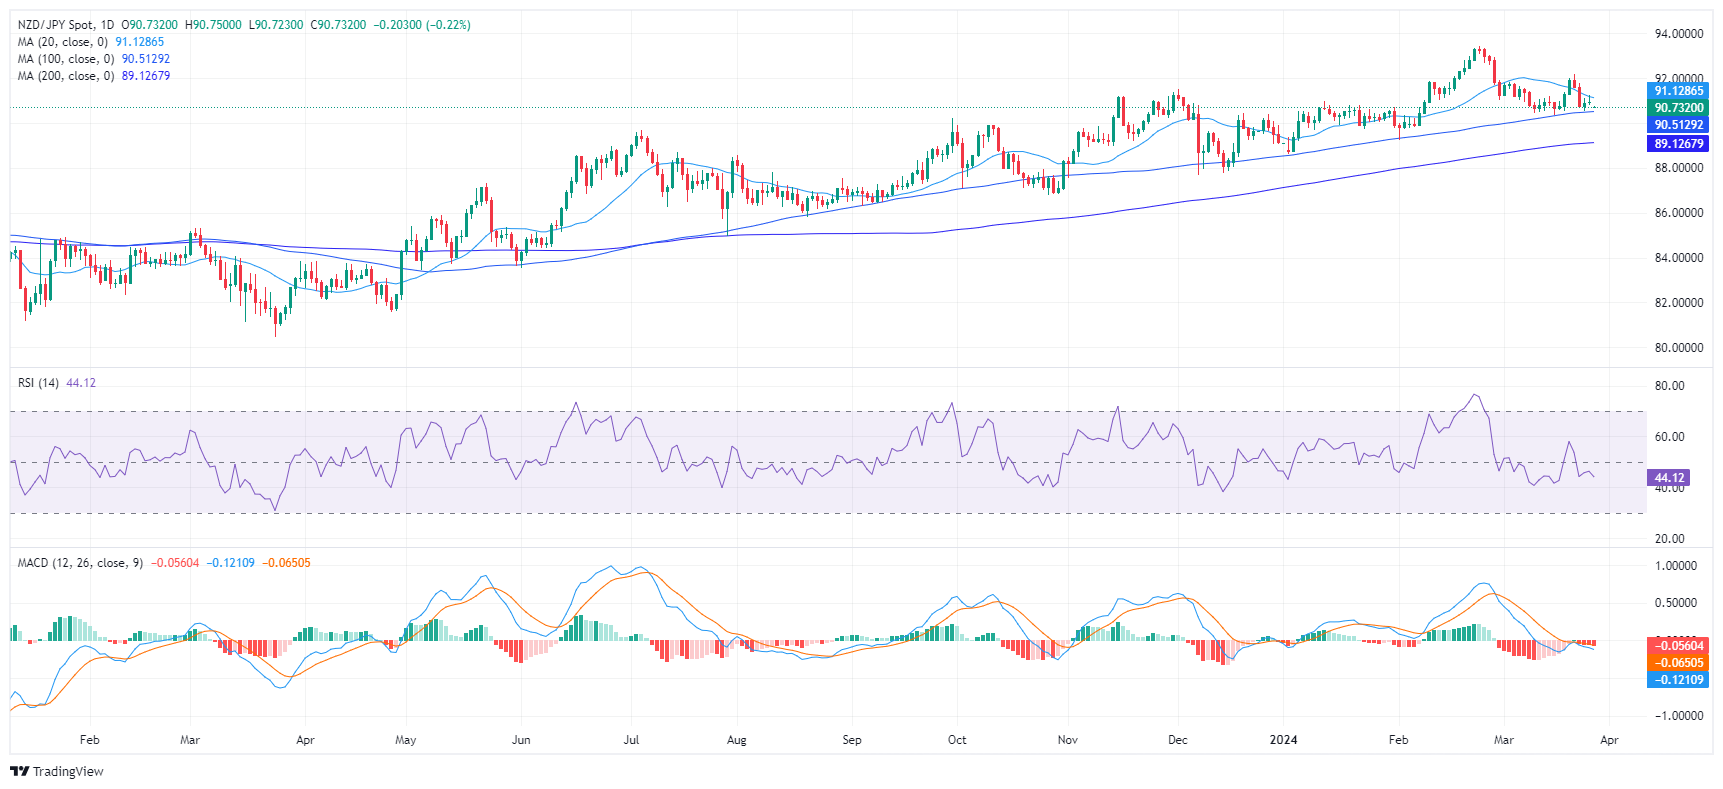
On the daily chart, the current market dynamics for the NZD/JPY pair reveal a neutral to negative trend as buyers are struggling to gather traction. The Relative Strength Index (RSI) presently resides in the negative territory. This trend is further emphasized by the red bars of the Moving Average Convergence Divergence (MACD), which reveals a steady selling momentum and weakened buying traction.
NZD/JPY daily chart
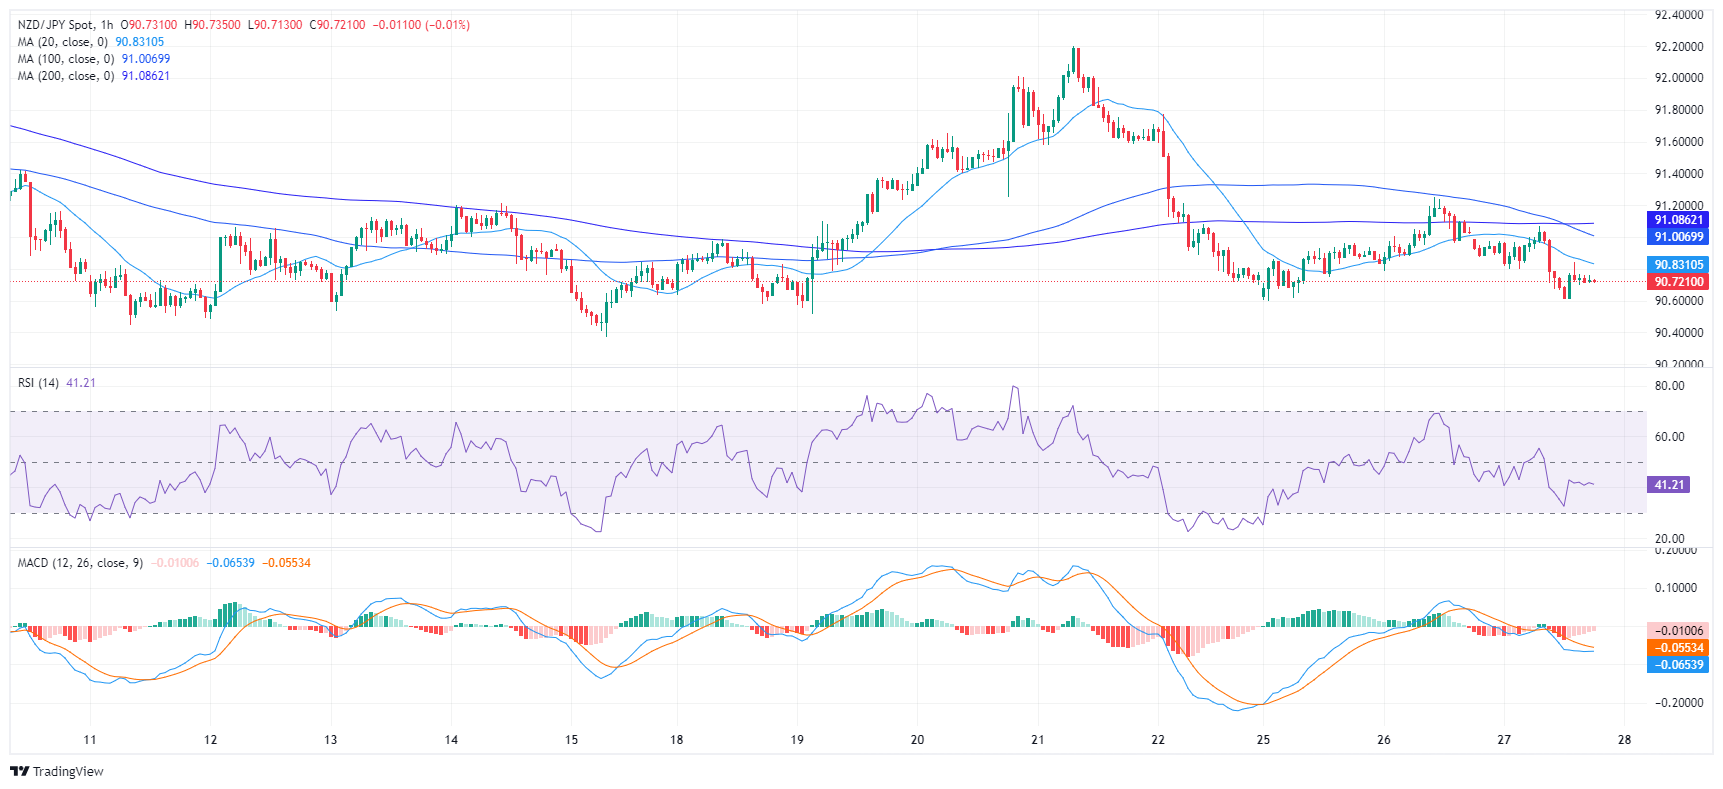
Switching to the hourly chart, the RSI recently read 41, which also positions it within negative territory. As with the daily chart, the MACD histogram on the hourly also illustrates flat red bars, further signifying weak market momentum.
NZD/JPY hourly chart
In conclusion, both the daily and hourly charts indicate a negative trend for NZD/JPY with weak buying pressure. Notwithstanding, on a larger scale, the pair remains above the 100 and 200-day Simple Moving Averages, hinting that bulls may still have broader control of the market. The negative market outlook could be further confirmed if the 20 and 100-day SMA complete a bearish crossover around the 91.00 area.


© 2000-2026. Bản quyền Teletrade.
Trang web này được quản lý bởi Teletrade D.J. LLC 2351 LLC 2022 (Euro House, Richmond Hill Road, Kingstown, VC0100, St. Vincent and the Grenadines).
Thông tin trên trang web không phải là cơ sở để đưa ra quyết định đầu tư và chỉ được cung cấp cho mục đích làm quen.
Giao dịch trên thị trường tài chính (đặc biệt là giao dịch sử dụng các công cụ biên) mở ra những cơ hội lớn và tạo điều kiện cho các nhà đầu tư sẵn sàng mạo hiểm để thu lợi nhuận, tuy nhiên nó mang trong mình nguy cơ rủi ro khá cao. Chính vì vậy trước khi tiến hành giao dịch cần phải xem xét mọi mặt vấn đề chấp nhận tiến hành giao dịch cụ thể xét theo quan điểm của nguồn lực tài chính sẵn có và mức độ am hiểu thị trường tài chính.
Sử dụng thông tin: sử dụng toàn bộ hay riêng biệt các dữ liệu trên trang web của công ty TeleTrade như một nguồn cung cấp thông tin nhất định. Việc sử dụng tư liệu từ trang web cần kèm theo liên kết đến trang teletrade.vn. Việc tự động thu thập số liệu cũng như thông tin từ trang web TeleTrade đều không được phép.
Xin vui lòng liên hệ với pr@teletrade.global nếu có câu hỏi.
ngân hàng