- Phân tích
- Tin tức và các công cụ
- Tin tức thị trường
- EUR/JPY Price Analysis: Bearish short-term trend surfaces, bullish outlook holds for broader timeframe
EUR/JPY Price Analysis: Bearish short-term trend surfaces, bullish outlook holds for broader timeframe
- Even though daily chart indicators reveal weakening momentum, the overall trend remains positive.
- In the hourly chart, the RSI deep in the negative area implies sellers are in charge during the day's trading.
- To maintain momentum, the bulls need to defend the 20-day SMA.
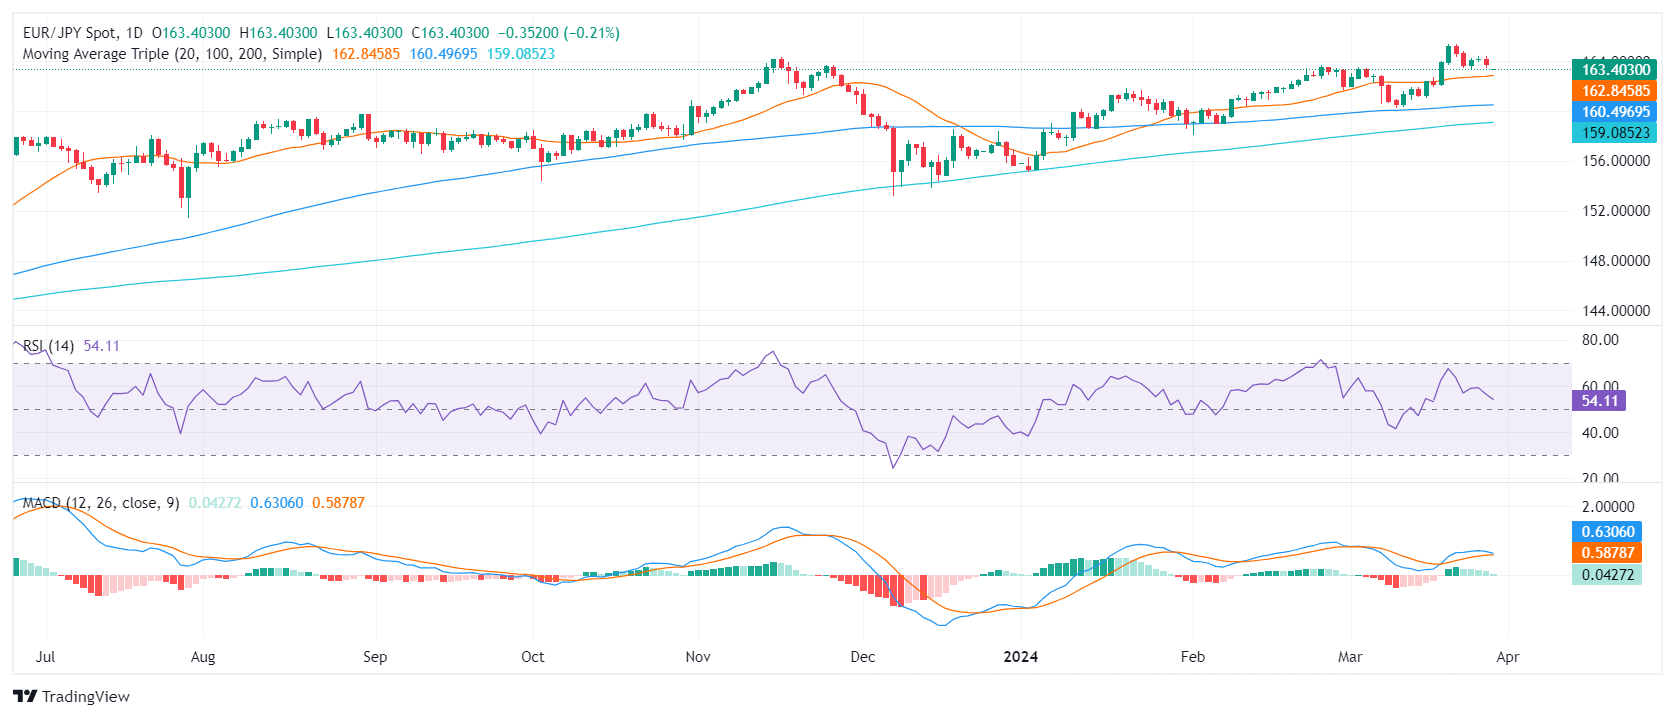
In Thursday's session, the EUR/JPY pair is trading at around 163.40, experiencing a minor loss. The broader perspective leans in favor of the bulls, indicating buying strength that keeps the pair above its 20, 100, and 200-day Simple Moving Averages (SMAs). Despite this, there is evidence of mounting selling pressure on the daily chart.
On the daily chart, the Relative Strength Index (RSI) descended from nearing overbought conditions last week towards 54. The MACD histogram also indicates that buyer momentum might be waning, as inferred from the flat green bars. These market indicators suggest potential near-term volatility in the pair's direction.
EUR/JPY daily chart
Transitioning to the hourly chart, RSI readings convey a more negative sentiment. The latest value stands at 44, signaling sellers as dominant in the short-term movements. The MACD histogram, however, prints green bars which adds neutrality to the intraday outlook.
EUR/JPY hourly chart
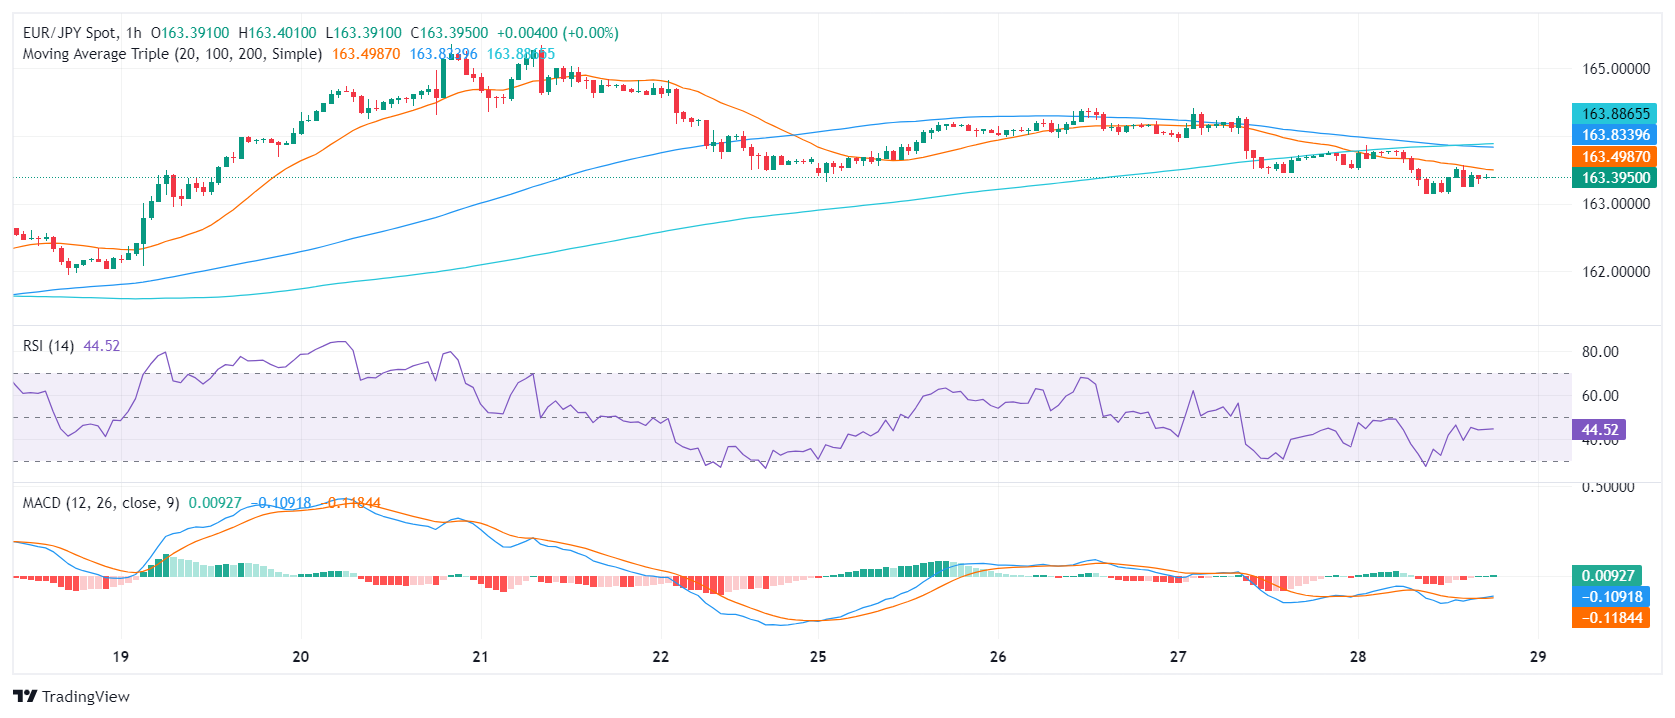
In conclusion, despite the negative sentiment on the hourly chart, the daily and broader metrics suggest that bulls maintain control of the bigger picture. The main task fo the buyers is to defend the 20-day SMA at around 163.00 and as long as the pair remains above this level, the outlook will be positive.


© 2000-2026. Bản quyền Teletrade.
Trang web này được quản lý bởi Teletrade D.J. LLC 2351 LLC 2022 (Euro House, Richmond Hill Road, Kingstown, VC0100, St. Vincent and the Grenadines).
Thông tin trên trang web không phải là cơ sở để đưa ra quyết định đầu tư và chỉ được cung cấp cho mục đích làm quen.
Giao dịch trên thị trường tài chính (đặc biệt là giao dịch sử dụng các công cụ biên) mở ra những cơ hội lớn và tạo điều kiện cho các nhà đầu tư sẵn sàng mạo hiểm để thu lợi nhuận, tuy nhiên nó mang trong mình nguy cơ rủi ro khá cao. Chính vì vậy trước khi tiến hành giao dịch cần phải xem xét mọi mặt vấn đề chấp nhận tiến hành giao dịch cụ thể xét theo quan điểm của nguồn lực tài chính sẵn có và mức độ am hiểu thị trường tài chính.
Sử dụng thông tin: sử dụng toàn bộ hay riêng biệt các dữ liệu trên trang web của công ty TeleTrade như một nguồn cung cấp thông tin nhất định. Việc sử dụng tư liệu từ trang web cần kèm theo liên kết đến trang teletrade.vn. Việc tự động thu thập số liệu cũng như thông tin từ trang web TeleTrade đều không được phép.
Xin vui lòng liên hệ với pr@teletrade.global nếu có câu hỏi.
ngân hàng