- Phân tích
- Tin tức và các công cụ
- Tin tức thị trường
- NZD/JPY Price Analysis: Bears maintain control, pushes cross below the 100-day SMA
NZD/JPY Price Analysis: Bears maintain control, pushes cross below the 100-day SMA
- Daily chart signals rising selling traction with the pair now below the key level of 90.50.
- Hourly chart indicators depict a potential consolidation period with indicators somewhat flat.
- The last hope for the cross is now the 200-day SMA.
In Thursday's session, the NZD/JPY declined to 90.40, with a decline of 0.43%. Bears are in control after successfully conquering the 100-day Simple Moving Average (SMA) while the selling momentum seems to have flattened on the hourly time frame.
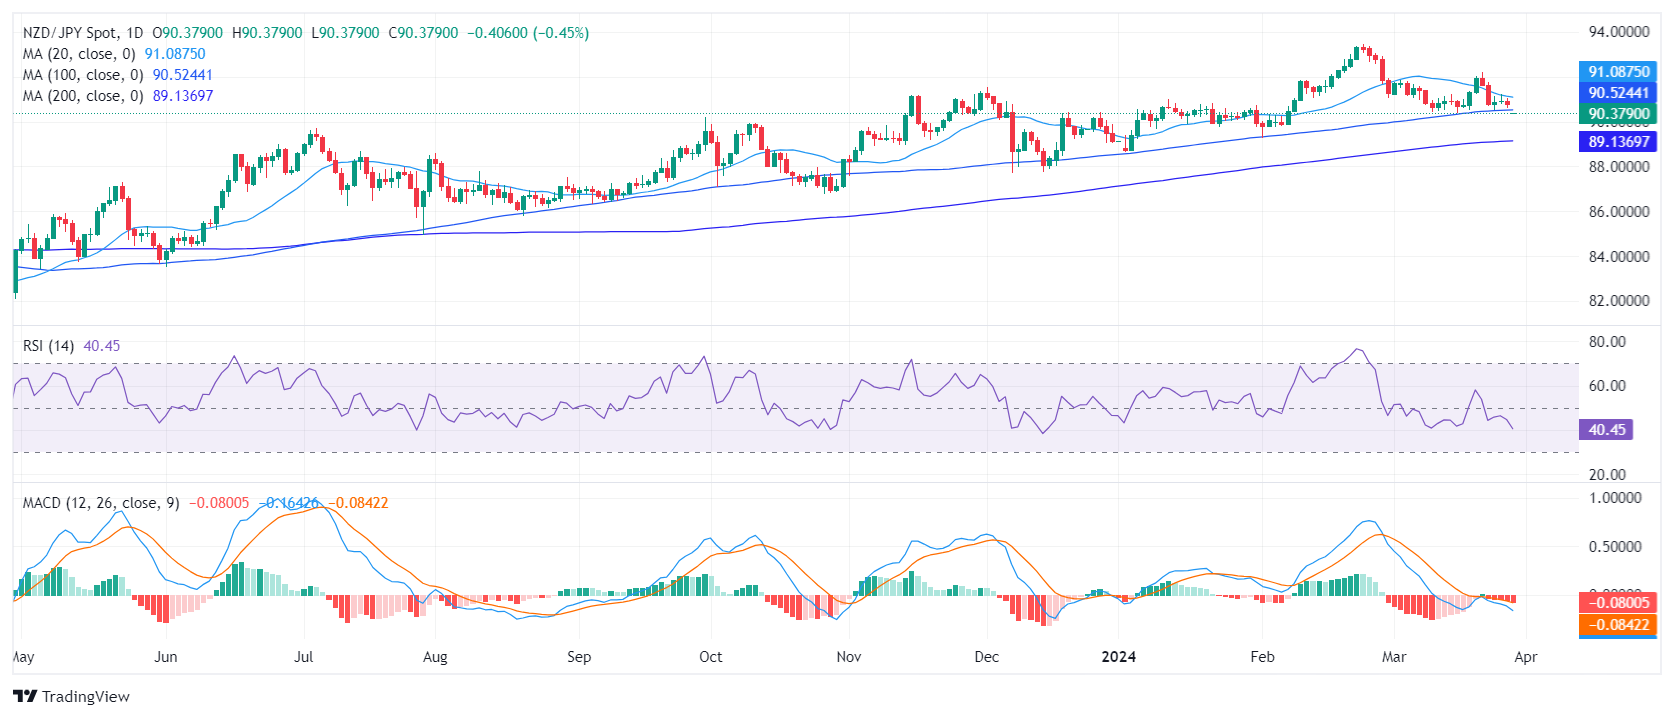
On the daily chart, the NZD/JPY pair exhibits a faltering momentum. Despite intermittent upticks, the Relative Strength Index (RSI) has spent much of the last sessions in negative territory, indicating a dominance of sellers. The Moving Average Convergence Divergence (MACD) complements this view as it showcases rising red bars, pointing toward an increase in negative momentum.
NZD/JPY daily chart
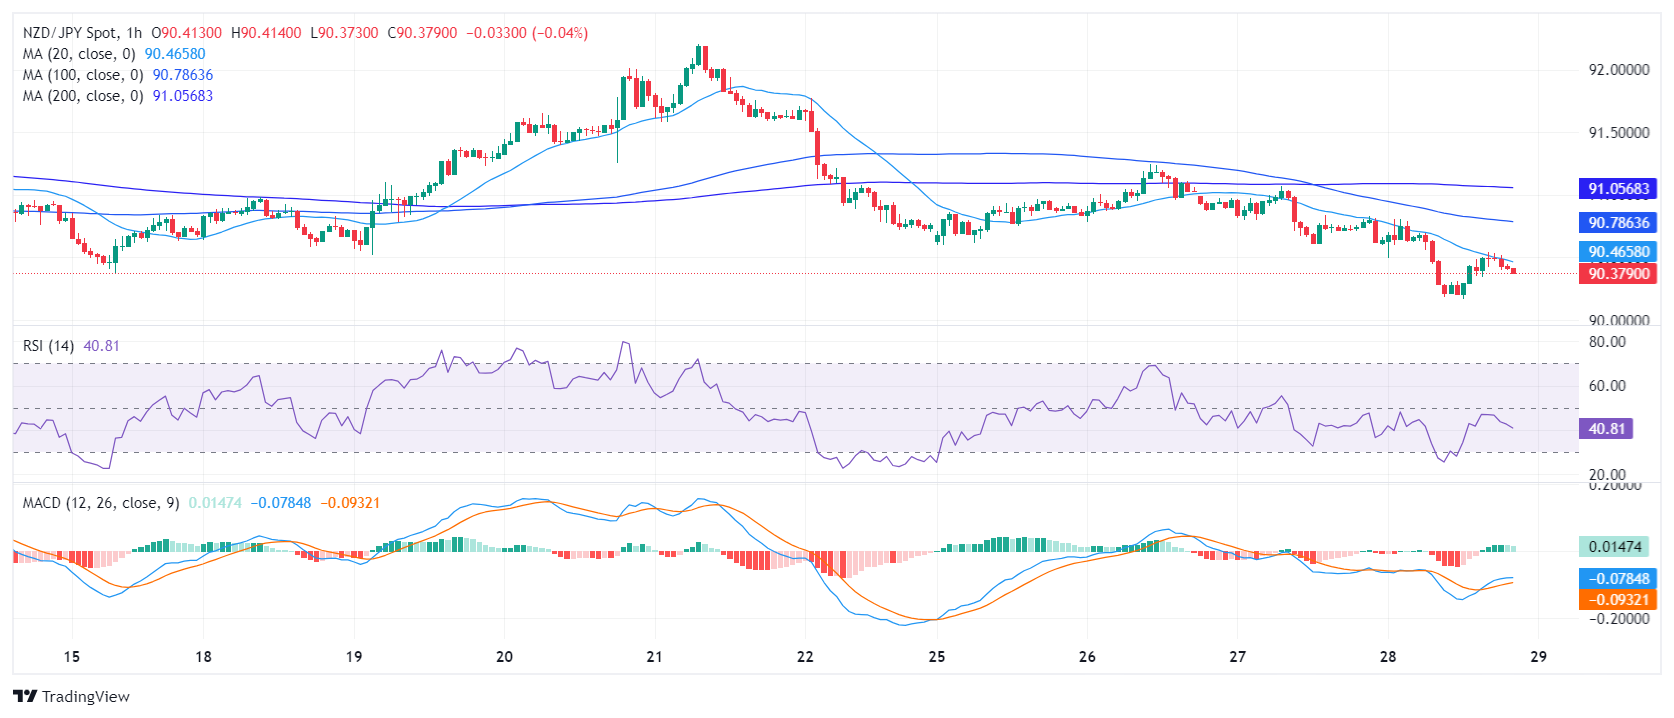
Switching to the hourly chart, RSI values are mildly oscillating in the negative territory with the latest reading clocked at 42. The hourly MACD histogram adds to the complexity as it reveals green bars that suggest the downward momentum might be slowing. Comparing the daily and hourly charts, contrasting signals hint at a period of consolidation for NZD/JPY before a clearer direction emerges.
NZD/JPY hourly chart
 On a larger scale, the pair resides now below the 20 and 100-day Simple Moving Averages (SMAs), indicating bearishness. Yet, its position above the 200-day SMA adds a hint of bullish potential. However, as bearish momentum is growing, the sellers might attack the longer moving average to confirm the negative trend.


© 2000-2026. Bản quyền Teletrade.
Trang web này được quản lý bởi Teletrade D.J. LLC 2351 LLC 2022 (Euro House, Richmond Hill Road, Kingstown, VC0100, St. Vincent and the Grenadines).
Thông tin trên trang web không phải là cơ sở để đưa ra quyết định đầu tư và chỉ được cung cấp cho mục đích làm quen.
Giao dịch trên thị trường tài chính (đặc biệt là giao dịch sử dụng các công cụ biên) mở ra những cơ hội lớn và tạo điều kiện cho các nhà đầu tư sẵn sàng mạo hiểm để thu lợi nhuận, tuy nhiên nó mang trong mình nguy cơ rủi ro khá cao. Chính vì vậy trước khi tiến hành giao dịch cần phải xem xét mọi mặt vấn đề chấp nhận tiến hành giao dịch cụ thể xét theo quan điểm của nguồn lực tài chính sẵn có và mức độ am hiểu thị trường tài chính.
Sử dụng thông tin: sử dụng toàn bộ hay riêng biệt các dữ liệu trên trang web của công ty TeleTrade như một nguồn cung cấp thông tin nhất định. Việc sử dụng tư liệu từ trang web cần kèm theo liên kết đến trang teletrade.vn. Việc tự động thu thập số liệu cũng như thông tin từ trang web TeleTrade đều không được phép.
Xin vui lòng liên hệ với pr@teletrade.global nếu có câu hỏi.
ngân hàng