- Phân tích
- Tin tức và các công cụ
- Tin tức thị trường
- GBP/JPY Price Analysis: Consolidates around 191.00 amid thin liquidity conditions
GBP/JPY Price Analysis: Consolidates around 191.00 amid thin liquidity conditions
- GBP/JPY hovers around 191.00, reflecting market caution ahead of Japanese unemployment and industrial production updates.
- Wall Street ends Q1 on a mixed note, with UK's recession confirmation and vigilance over JPY's weakness influencing sentiment.
- Technical analysis suggests potential for movement if GBP/JPY breaches key levels, with 192.00 and 193.00 as notable targets.
The GBP/JPY barely moved on Thursday amid thin liquidity conditions and is hovering around 191.00, virtually unchanged as Friday’s Asian session begins.
Wall Street posted a stellar first quarter of 2024, with the S&P 500 and the Dow Jones finishing in the green. The outlier was the Nasdaq Composite, which dropped 0.12% in the last trading day of Q1.
In addition, economic data from the UK showed that Britain’s economy hit a technical recession, as expected by the market consensus. In Japan, authorities remain vigilant about the Japanese Yen's (JPY) weakness, which sent the USD/JPY rallying near 152.00.
As the Asian session begins, the Japanese economic docket will reveal the unemployment rate for February, which is expected to remain at 2.4%. At the same time, Industrial Production figures for the same month are expected to rise from -6.7% MoM to 1.4%, while Retail Sales are foreseen to expand by 3%.
GBP/JPY Price Analysis: Technical outlook
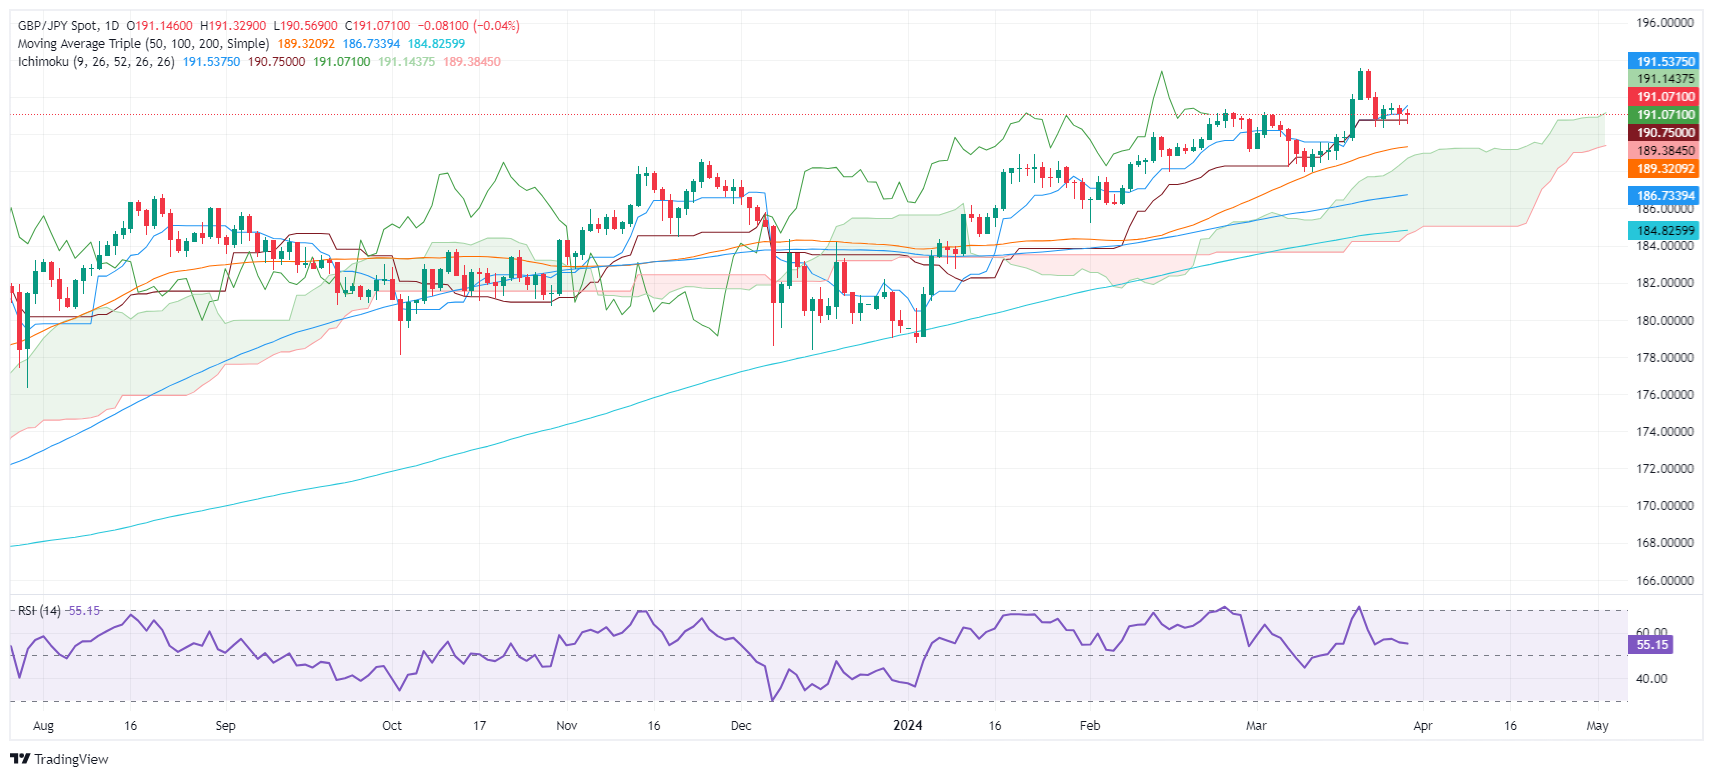
The GBP/JPY is subdued as liquidity conditions tumble. If buyers regain control, they must push prices above the Tenkan-Sen level at 191.57, which could open the door to challenge 192.00. Further upside is seen at 193.00, followed by the year-to-date (YTD) high at 193.53
On the flip side, if the pair drops below 191.00, that would pave the way for further losses. The next support would be the Kijuin-Sen at 190.74, followed by the 190.00 mark.
GBP/JPY Price Action – Daily Chart


© 2000-2026. Bản quyền Teletrade.
Trang web này được quản lý bởi Teletrade D.J. LLC 2351 LLC 2022 (Euro House, Richmond Hill Road, Kingstown, VC0100, St. Vincent and the Grenadines).
Thông tin trên trang web không phải là cơ sở để đưa ra quyết định đầu tư và chỉ được cung cấp cho mục đích làm quen.
Giao dịch trên thị trường tài chính (đặc biệt là giao dịch sử dụng các công cụ biên) mở ra những cơ hội lớn và tạo điều kiện cho các nhà đầu tư sẵn sàng mạo hiểm để thu lợi nhuận, tuy nhiên nó mang trong mình nguy cơ rủi ro khá cao. Chính vì vậy trước khi tiến hành giao dịch cần phải xem xét mọi mặt vấn đề chấp nhận tiến hành giao dịch cụ thể xét theo quan điểm của nguồn lực tài chính sẵn có và mức độ am hiểu thị trường tài chính.
Sử dụng thông tin: sử dụng toàn bộ hay riêng biệt các dữ liệu trên trang web của công ty TeleTrade như một nguồn cung cấp thông tin nhất định. Việc sử dụng tư liệu từ trang web cần kèm theo liên kết đến trang teletrade.vn. Việc tự động thu thập số liệu cũng như thông tin từ trang web TeleTrade đều không được phép.
Xin vui lòng liên hệ với pr@teletrade.global nếu có câu hỏi.
ngân hàng