- Phân tích
- Tin tức và các công cụ
- Tin tức thị trường
- EUR/GBP Price Analysis: Bearish sentiment prevails, daily and hourly trends lean negative
EUR/GBP Price Analysis: Bearish sentiment prevails, daily and hourly trends lean negative
- The daily chart reveals a mostly bearish environment with somewhat flat indicators.
- The hourly chart analysis depicts a potential bearish shift with the RSI reading close to the neutral-negative zone.
The EUR/GBP pair is currently trading at 0.8550, with minor losses on Friday’s session. The sellers are exerting their presence as bullish momentum remains weak and the fact that the cross remains below its main Simple Moving Averages (SMAs) of 20,100 and 200-days contributes to the bearish bias.
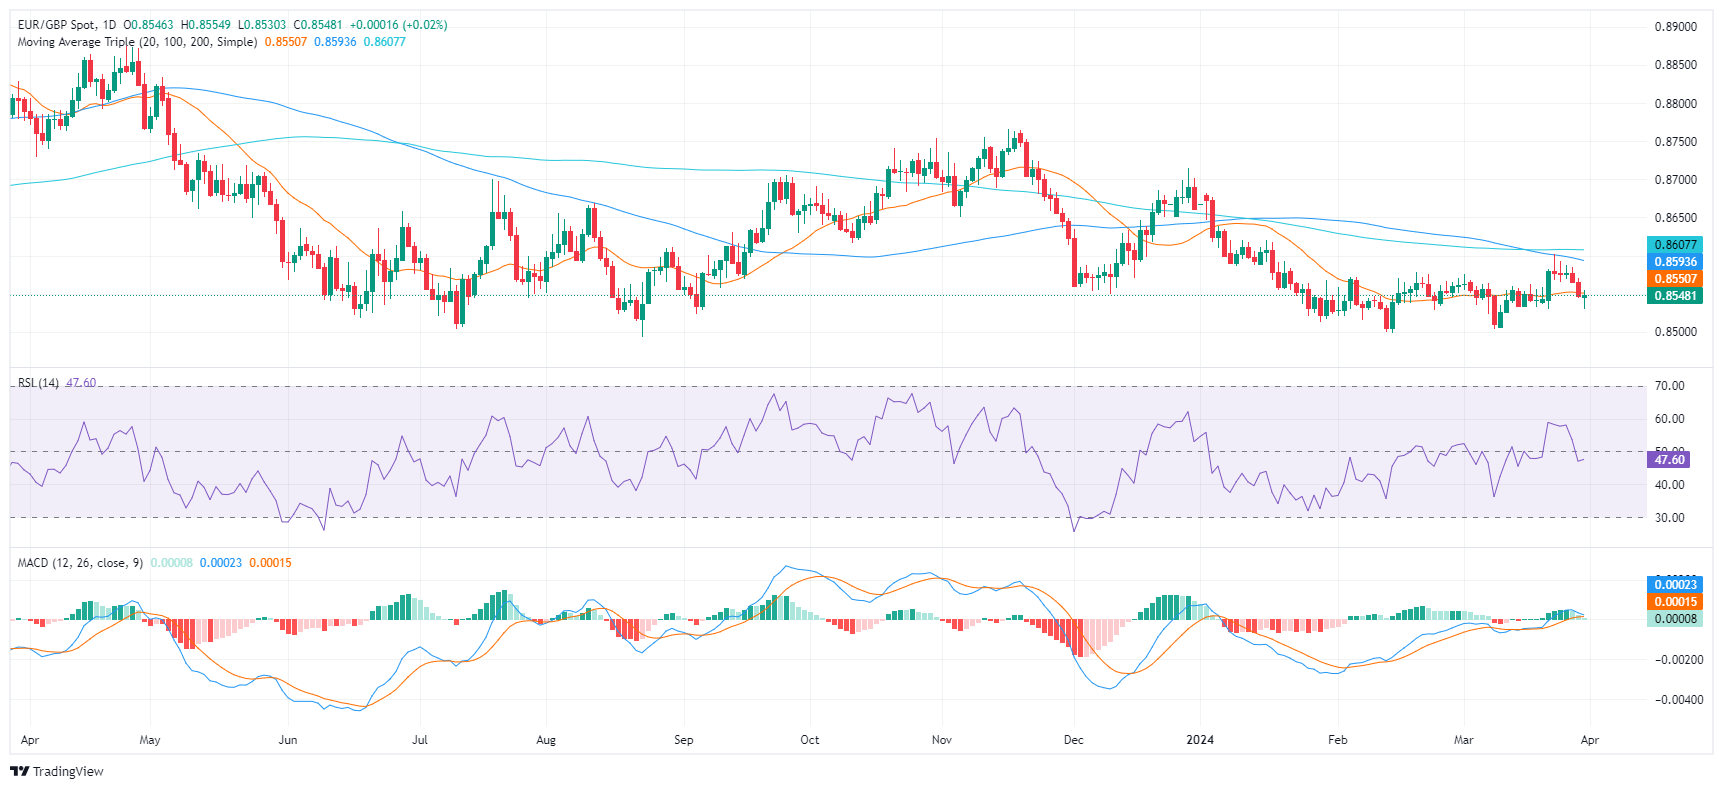
On the daily chart, the Relative Strength Index (RSI) currently resides in negative territory but stands flat while the Moving Average Convergence Divergence (MACD) prints neutral green bars, suggesting stagnant momentum. This demonstrates the trend might continue in the near term.
EUR/GBP daily chart
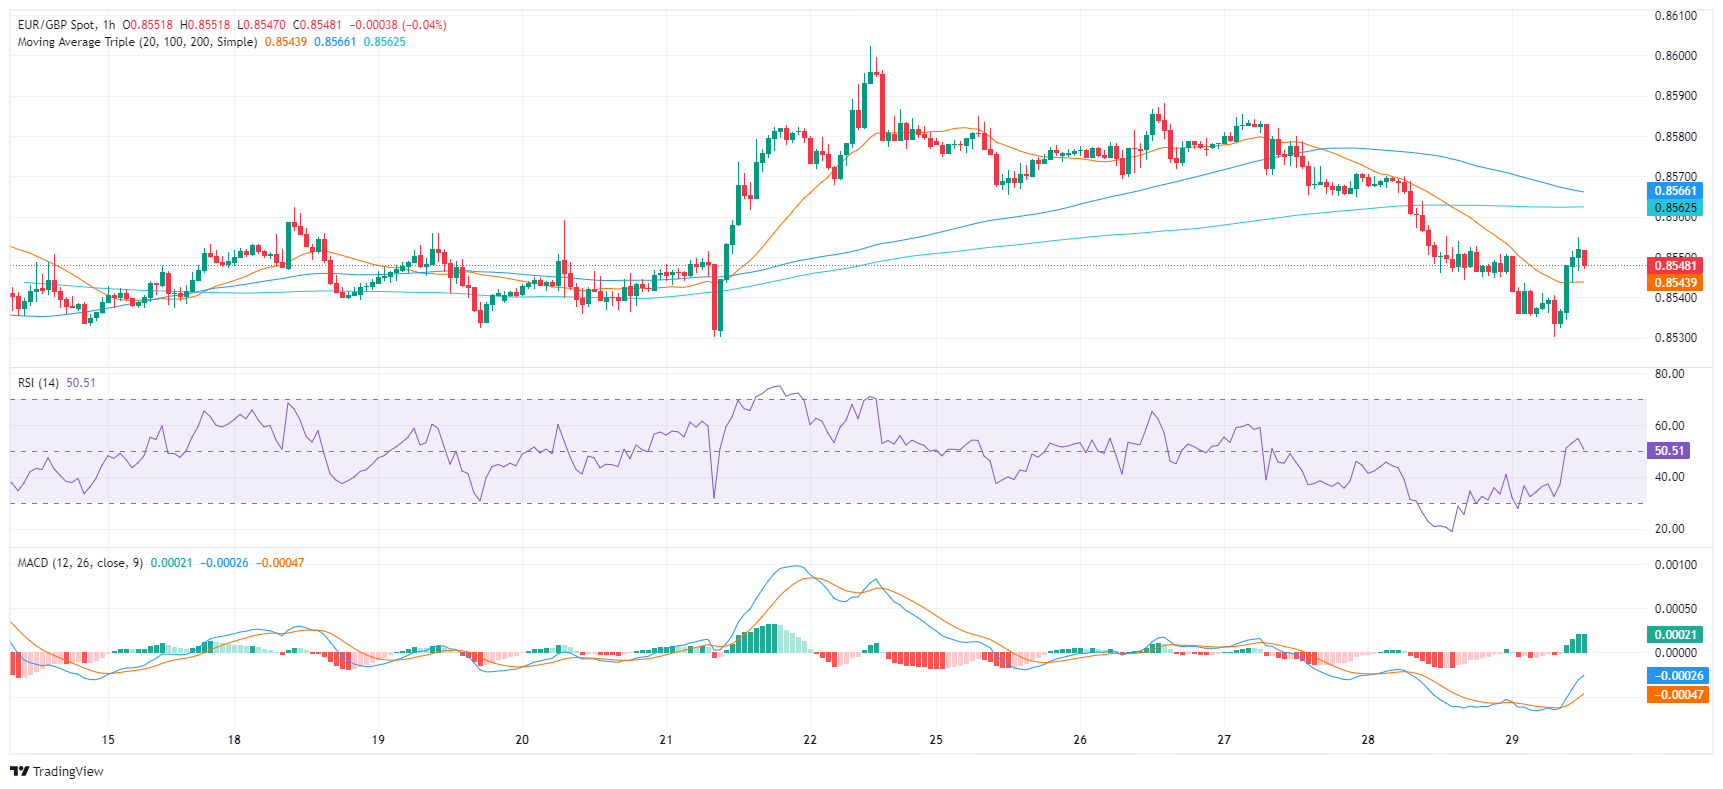
Moving to the hourly chart, the RSI shows a mixed trend with readings ranging from 33 and then recovering to 50 standing on the edge of the neutral-negative territory. Coupled with flat green bars on the MACD histogram, there might be a shift towards a bearish momentum after the bulls' short recovery during the European session.
EUR/GBP hourly chart
In conclusion, both the daily and hourly analyses point to a primarily negative trend for EUR/GBP, albeit with potential hourly fluctuations. If the buyers want to avoid losses they should reclaim the 200-day SMA around 0.8550 and build support around it.


© 2000-2026. Bản quyền Teletrade.
Trang web này được quản lý bởi Teletrade D.J. LLC 2351 LLC 2022 (Euro House, Richmond Hill Road, Kingstown, VC0100, St. Vincent and the Grenadines).
Thông tin trên trang web không phải là cơ sở để đưa ra quyết định đầu tư và chỉ được cung cấp cho mục đích làm quen.
Giao dịch trên thị trường tài chính (đặc biệt là giao dịch sử dụng các công cụ biên) mở ra những cơ hội lớn và tạo điều kiện cho các nhà đầu tư sẵn sàng mạo hiểm để thu lợi nhuận, tuy nhiên nó mang trong mình nguy cơ rủi ro khá cao. Chính vì vậy trước khi tiến hành giao dịch cần phải xem xét mọi mặt vấn đề chấp nhận tiến hành giao dịch cụ thể xét theo quan điểm của nguồn lực tài chính sẵn có và mức độ am hiểu thị trường tài chính.
Sử dụng thông tin: sử dụng toàn bộ hay riêng biệt các dữ liệu trên trang web của công ty TeleTrade như một nguồn cung cấp thông tin nhất định. Việc sử dụng tư liệu từ trang web cần kèm theo liên kết đến trang teletrade.vn. Việc tự động thu thập số liệu cũng như thông tin từ trang web TeleTrade đều không được phép.
Xin vui lòng liên hệ với pr@teletrade.global nếu có câu hỏi.
ngân hàng