- Phân tích
- Tin tức và các công cụ
- Tin tức thị trường
- Silver Price Analysis: XAG/USD bulls have the upper hand above $25.00, over one-week top
Silver Price Analysis: XAG/USD bulls have the upper hand above $25.00, over one-week top
- Silver gains positive traction for the third straight day and climbs to over a one-week high.
- Mixed oscillators on the daily chart warrant some caution for aggressive bullish traders.
- Weakness below the $25.00 mark is more likely to get bought into and remain limited.
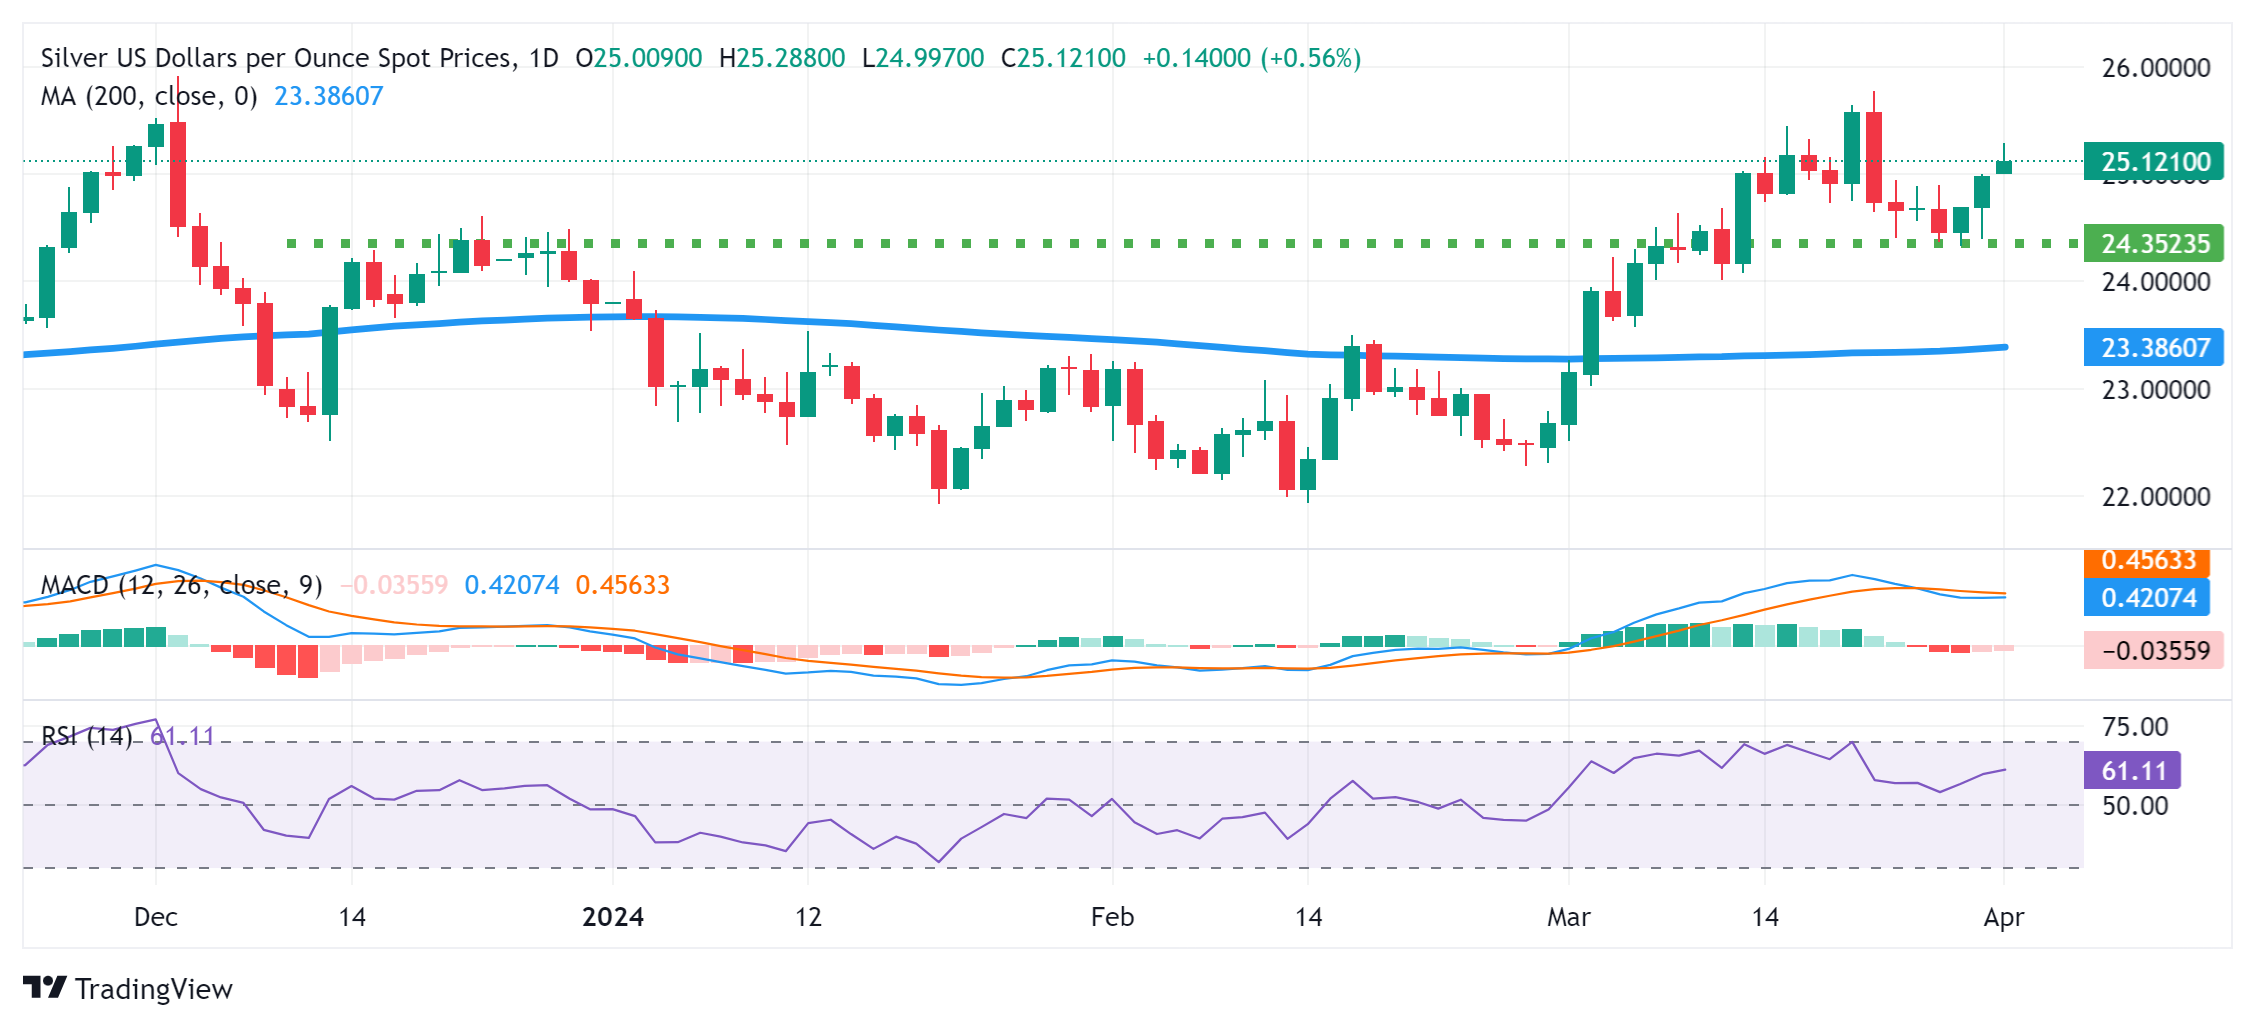
Silver (XAG/USD) builds on last week's bounce from the $24.35 resistance-turned-support zone and gains positive traction for the third successive day on Monday. The white metal sticks to its intraday gains through the first half of the European session and currently trades around the $25.15 region, just below a more than one-week top touched earlier today.
Meanwhile, mixed technical indicators on the daily chart warrant some caution for bullish traders. Hence, any subsequent move up is more likely to confront stiff resistance near the $25.65-$25.75 region, or the YTD peak touched in March. This is closely followed by the December 2023 swing high – levels just ahead of the $26.00 round figure. A sustained strength beyond the said handle should allow the XAG/USD to resume its recent strong uptrend witnessed since late February.
On the flip side, weakness back below the $25.00 psychological mark is likely to attract fresh buyers near the $24.65 region. This should help limit the downside for the XAG/USD near the aforementioned resistance-turned-support, around the $24.35 zone. The latter should act as a key pivotal point, which if broken decisively might shift the bias in favour of bearish traders and drag the white metal to the next relevant support near the $24.15-$24.10 region en route to the $24.00 mark.
Some follow-through selling would make the XAG/SUD vulnerable to accelerate the downward trajectory further towards the 200-day Simple Moving Average (SMA), currently pegged around the $23.35-$23.30 region.
Silver daily chart


© 2000-2026. Bản quyền Teletrade.
Trang web này được quản lý bởi Teletrade D.J. LLC 2351 LLC 2022 (Euro House, Richmond Hill Road, Kingstown, VC0100, St. Vincent and the Grenadines).
Thông tin trên trang web không phải là cơ sở để đưa ra quyết định đầu tư và chỉ được cung cấp cho mục đích làm quen.
Giao dịch trên thị trường tài chính (đặc biệt là giao dịch sử dụng các công cụ biên) mở ra những cơ hội lớn và tạo điều kiện cho các nhà đầu tư sẵn sàng mạo hiểm để thu lợi nhuận, tuy nhiên nó mang trong mình nguy cơ rủi ro khá cao. Chính vì vậy trước khi tiến hành giao dịch cần phải xem xét mọi mặt vấn đề chấp nhận tiến hành giao dịch cụ thể xét theo quan điểm của nguồn lực tài chính sẵn có và mức độ am hiểu thị trường tài chính.
Sử dụng thông tin: sử dụng toàn bộ hay riêng biệt các dữ liệu trên trang web của công ty TeleTrade như một nguồn cung cấp thông tin nhất định. Việc sử dụng tư liệu từ trang web cần kèm theo liên kết đến trang teletrade.vn. Việc tự động thu thập số liệu cũng như thông tin từ trang web TeleTrade đều không được phép.
Xin vui lòng liên hệ với pr@teletrade.global nếu có câu hỏi.
ngân hàng