- Phân tích
- Tin tức và các công cụ
- Tin tức thị trường
- EUR/JPY Price Analysis: Bearish momentum gains steam, long-term bullish signals warrant vigilance
EUR/JPY Price Analysis: Bearish momentum gains steam, long-term bullish signals warrant vigilance
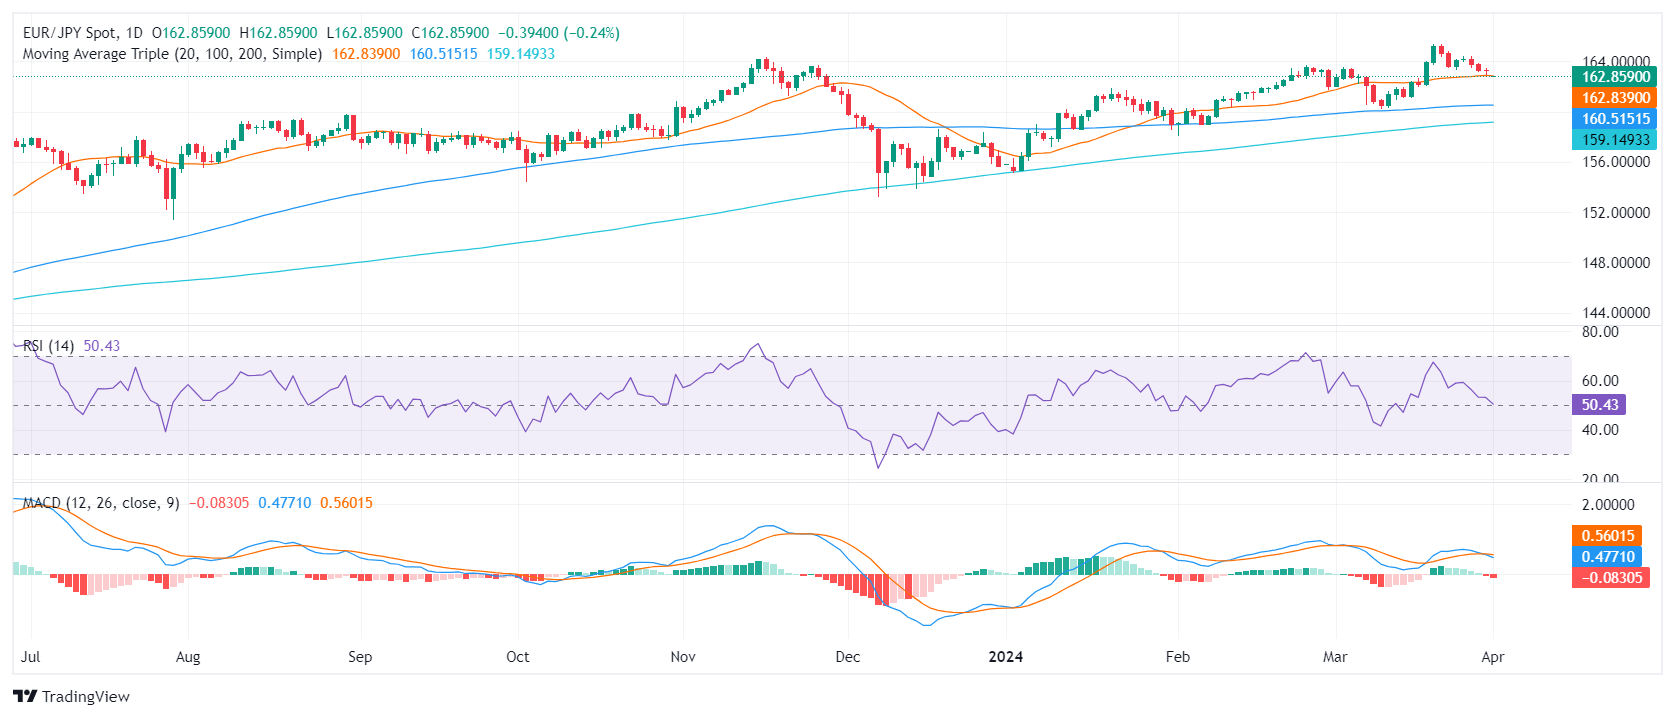
- Significant selling momentum is revealed in the daily chart as the RSI slips into negative zones while MACD signifies growing negative traction.
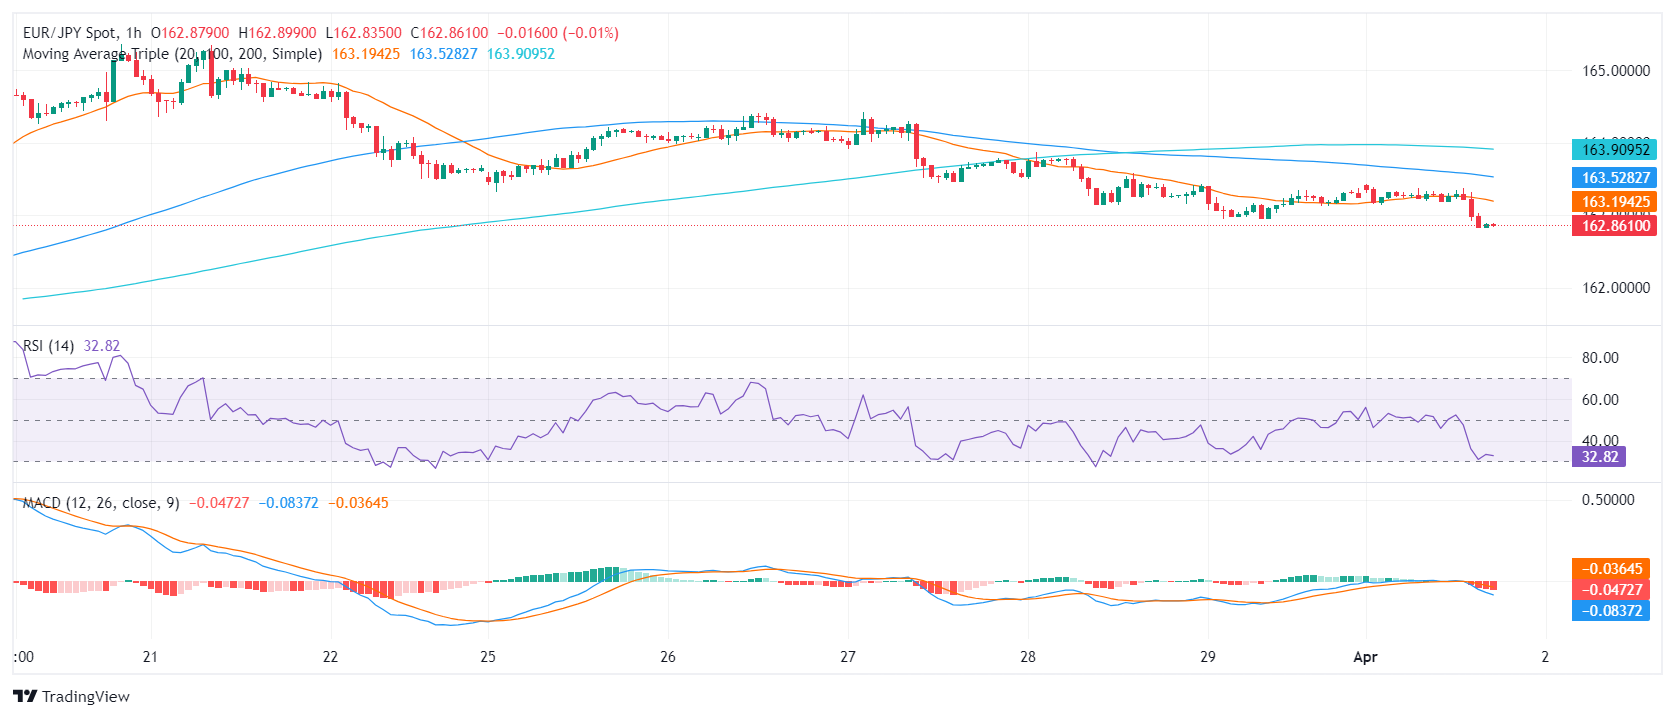
- In line with the daily chart, the hourly indicators show mounting selling pressure.
- The recent dip beneath the 20-day SMA may suggest a possible short-term bearish realignment.
The EUR/JPY pair is currently trading around 162.85, representing a decline of 0.30% during Monday's session. Bearish cues are intensifying as seen in the increase in selling momentum, which signals a possible shift from the preceding bullish trend.
On the daily chart for EUR/JPY, the most recent Relative Strength Index (RSI) reading fell near negative territory. This situation tends to indicate a growing selling momentum. Concurrently, the Moving Average Convergence Divergence (MACD) histogram showcases rising red bars, implying a surge in negative momentum.
EUR/JPY daily chart
Assessing the hourly chart, the EUR/JPY pair showcases similar bearish sentiments. The RSI dipped near the oversold territory demonstrating the sellers' dominance in the market over the recent hours. Adding to this, the hourly MACD histogram reinforces this sentiment, illustrating rising red bars indicating a tilt towards negative momentum.
EUR/JPY hourly chart
Scrutinizing the broader outlook, EUR/JPY portrays a blend of bullish and bearish signals. A bullish stance manifests through its standing above the 100-day and 200-day Simple Moving Averages (SMA), revealing a positive trend for the pair in the long run. However, the cross has dipped just below the 20-day SMA today, inferring a potential bearish shift in the short term.
In summary, although the longer-term trends demonstrate a predominantly bullish stance for EUR/JPY, recent readings from both the daily and hourly charts suggest a possible shift towards a sellers' market which could fuel additional downward movements in case the buyers fail to step in.


© 2000-2026. Bản quyền Teletrade.
Trang web này được quản lý bởi Teletrade D.J. LLC 2351 LLC 2022 (Euro House, Richmond Hill Road, Kingstown, VC0100, St. Vincent and the Grenadines).
Thông tin trên trang web không phải là cơ sở để đưa ra quyết định đầu tư và chỉ được cung cấp cho mục đích làm quen.
Giao dịch trên thị trường tài chính (đặc biệt là giao dịch sử dụng các công cụ biên) mở ra những cơ hội lớn và tạo điều kiện cho các nhà đầu tư sẵn sàng mạo hiểm để thu lợi nhuận, tuy nhiên nó mang trong mình nguy cơ rủi ro khá cao. Chính vì vậy trước khi tiến hành giao dịch cần phải xem xét mọi mặt vấn đề chấp nhận tiến hành giao dịch cụ thể xét theo quan điểm của nguồn lực tài chính sẵn có và mức độ am hiểu thị trường tài chính.
Sử dụng thông tin: sử dụng toàn bộ hay riêng biệt các dữ liệu trên trang web của công ty TeleTrade như một nguồn cung cấp thông tin nhất định. Việc sử dụng tư liệu từ trang web cần kèm theo liên kết đến trang teletrade.vn. Việc tự động thu thập số liệu cũng như thông tin từ trang web TeleTrade đều không được phép.
Xin vui lòng liên hệ với pr@teletrade.global nếu có câu hỏi.
ngân hàng