- Phân tích
- Tin tức và các công cụ
- Tin tức thị trường
- AUD/JPY Price Analysis: Aussie soars, buyers start to back off on the hourly chart
AUD/JPY Price Analysis: Aussie soars, buyers start to back off on the hourly chart
- The daily chart presents a strong buying momentum with indicators deep in positive territory.
- On the hourly chart, the RSI resides in the overbought zone, suggesting a short-term consolidation of the recent gains.
In Wednesday's session, the AUD/JPY pair is trading at 99.58, following an increase of 0.82%. Buyers appear in control, but indicators are flashing signals of a short-term consolidation.
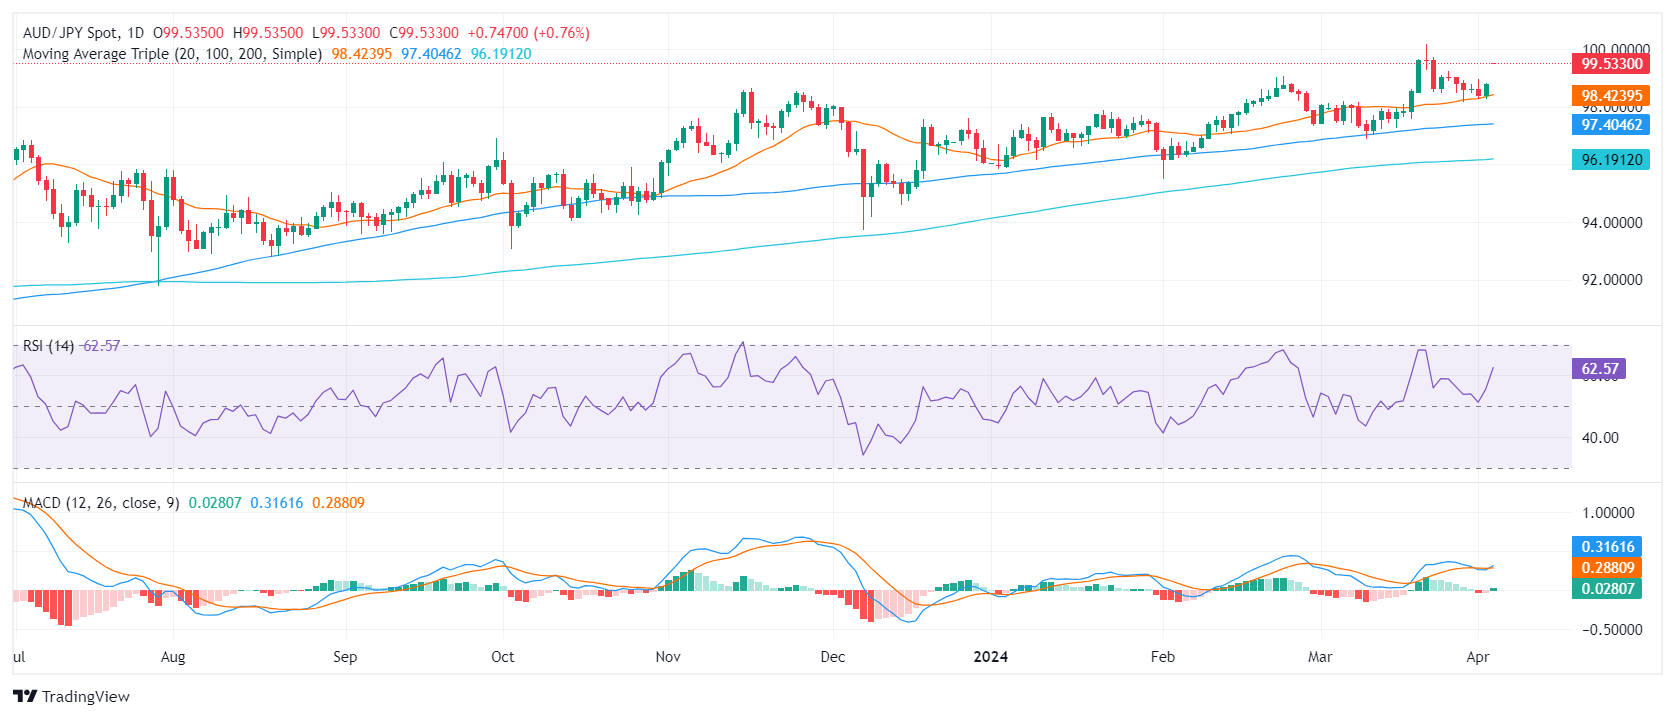
On the daily chart, the AUD/JPY pair reveals a bullish sentiment. The Relative Strength Index (RSI) resides deep in positive territory, with recent readings reaching as high as 61, indicating the domination of buyers in the market. Furthermore, the rising green bars on the Moving Average Convergence Divergence (MACD) histogram show a positive momentum, supporting the bullish outlook.
AUD/JPY daily chart
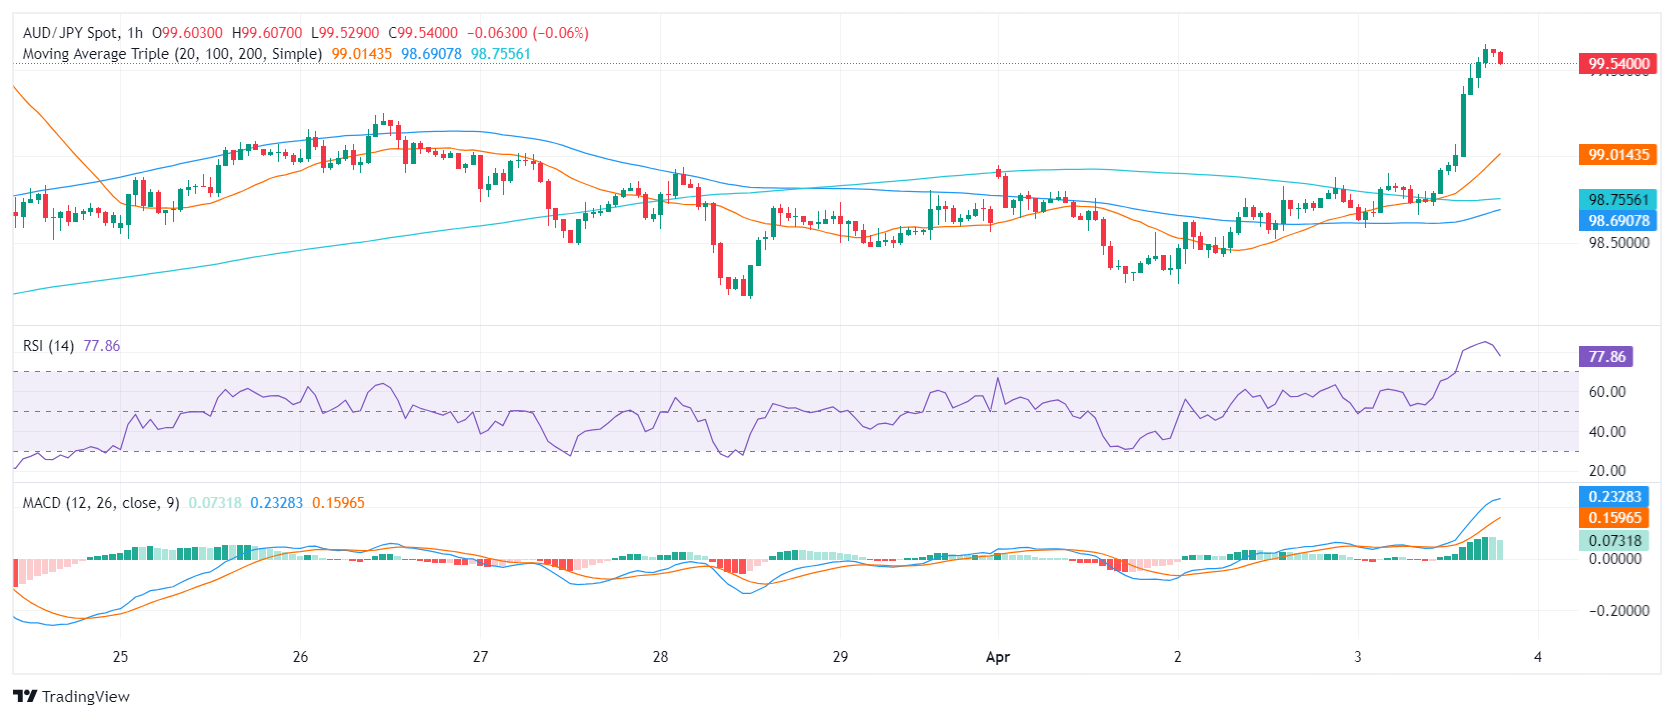
Upon inspecting the hourly chart, the RSI readings consistently hover in the overbought zone, with the latest entry at 78 but the index has started to edge downwards. A flat green histogram on the MACD also gives arguments for a short-term consolidation.
AUD/JPY hourly chart
Considering the broader outlook, the pair also stands above the 20,100 and 200-day Simple Moving Averages (SMAs). This setup suggests short-term and long-term trends are bullish, and traders may expect further upside.
In conclusion, both daily and hourly charts for the AUD/JPY pair highlight a bullish outlook. The RSI values and the MACD histograms across both timelines point to strong upward movement, with buyers currently holding market reins. However, indicators on the hourly chart point to further consolidation as they lie deep in the overbought zone.


© 2000-2026. Bản quyền Teletrade.
Trang web này được quản lý bởi Teletrade D.J. LLC 2351 LLC 2022 (Euro House, Richmond Hill Road, Kingstown, VC0100, St. Vincent and the Grenadines).
Thông tin trên trang web không phải là cơ sở để đưa ra quyết định đầu tư và chỉ được cung cấp cho mục đích làm quen.
Giao dịch trên thị trường tài chính (đặc biệt là giao dịch sử dụng các công cụ biên) mở ra những cơ hội lớn và tạo điều kiện cho các nhà đầu tư sẵn sàng mạo hiểm để thu lợi nhuận, tuy nhiên nó mang trong mình nguy cơ rủi ro khá cao. Chính vì vậy trước khi tiến hành giao dịch cần phải xem xét mọi mặt vấn đề chấp nhận tiến hành giao dịch cụ thể xét theo quan điểm của nguồn lực tài chính sẵn có và mức độ am hiểu thị trường tài chính.
Sử dụng thông tin: sử dụng toàn bộ hay riêng biệt các dữ liệu trên trang web của công ty TeleTrade như một nguồn cung cấp thông tin nhất định. Việc sử dụng tư liệu từ trang web cần kèm theo liên kết đến trang teletrade.vn. Việc tự động thu thập số liệu cũng như thông tin từ trang web TeleTrade đều không được phép.
Xin vui lòng liên hệ với pr@teletrade.global nếu có câu hỏi.
ngân hàng