- Phân tích
- Tin tức và các công cụ
- Tin tức thị trường
- NZD/JPY Price Analysis: Bearish reversal cues emerge, buyers give up gains
NZD/JPY Price Analysis: Bearish reversal cues emerge, buyers give up gains
- The daily chart signifies a bullish market; yet, the hourly chart shows hints of a short-term bearish reversal.
- The NZD significantly weakened during the American session and cleared daily gains.
- The hourly RSI dived from the overbought area near oversold terrain.
The NZD/JPY cleared all of its daily gains and fell by nearly 0.75% during the American session. Bearish clues emerge on the hourly chart, but the daily technical outlook remains somewhat bullish.
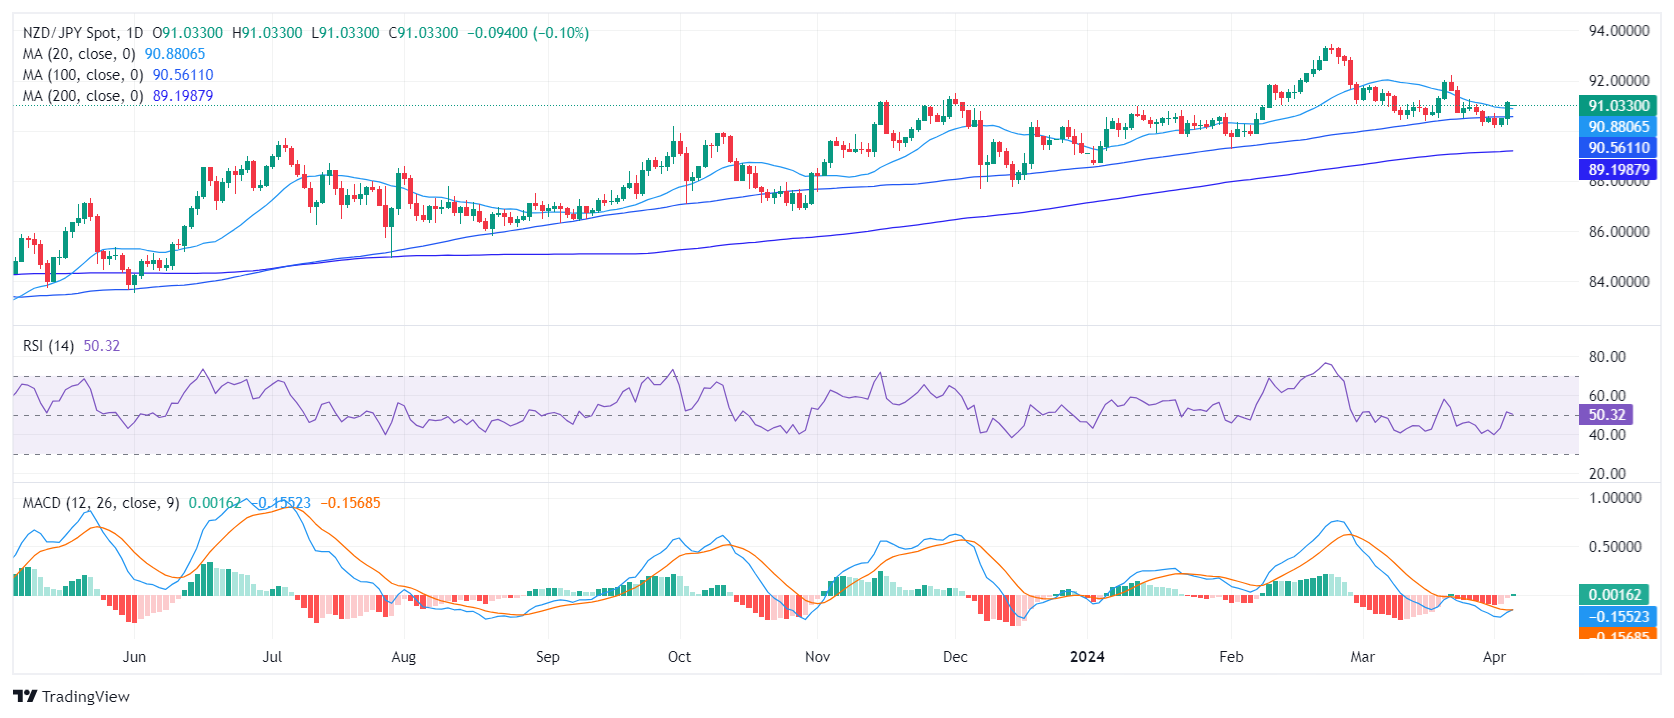
On the daily chart, the NZD/JPY Relative Strength Index (RSI) reveals its latest reading, slightly shifting towards a positive trend. The value is edging past the 50 mark after a period of predominantly being in negative terrain. However, with the latest RSI reading barely past 50, the momentum can still be seen as not strongly favoring the buyers.
NZD/JPY daily chart
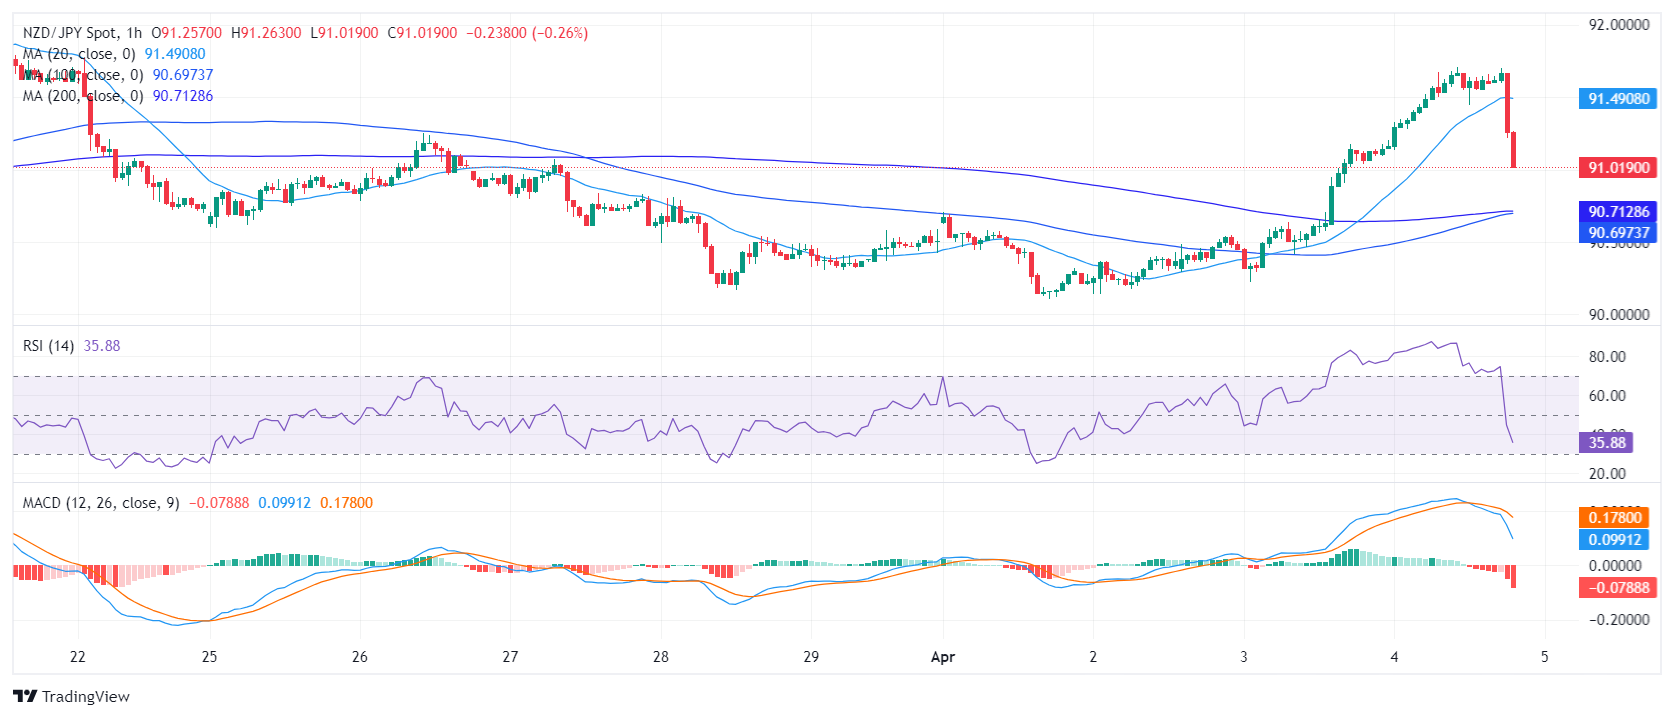
On the hourly RSI reading fell on the negative side after being near 70. The MACD histogram has begun to print rising red bars, also suggesting a rising negative momentum.
NZD/JPY hourly chart
Regarding the overall trend, the NZD/JPY pair jumped above the 20-day SMA today, often serving as a bullish short-term signal. In addition, the pair stands above its 100 and 200-day Simple Moving Average (SMA), also flashing a long-term positive outlook.
In conclusion, based on both the daily and hourly trends, plus taking the position in relation to the SMA into consideration, the NZD/JPY shows signs of a potential shift from a bearish to a bullish stance in the immediate term. However, if the bulls hold the above main SMAs, the outlook will still be positive.


© 2000-2026. Bản quyền Teletrade.
Trang web này được quản lý bởi Teletrade D.J. LLC 2351 LLC 2022 (Euro House, Richmond Hill Road, Kingstown, VC0100, St. Vincent and the Grenadines).
Thông tin trên trang web không phải là cơ sở để đưa ra quyết định đầu tư và chỉ được cung cấp cho mục đích làm quen.
Giao dịch trên thị trường tài chính (đặc biệt là giao dịch sử dụng các công cụ biên) mở ra những cơ hội lớn và tạo điều kiện cho các nhà đầu tư sẵn sàng mạo hiểm để thu lợi nhuận, tuy nhiên nó mang trong mình nguy cơ rủi ro khá cao. Chính vì vậy trước khi tiến hành giao dịch cần phải xem xét mọi mặt vấn đề chấp nhận tiến hành giao dịch cụ thể xét theo quan điểm của nguồn lực tài chính sẵn có và mức độ am hiểu thị trường tài chính.
Sử dụng thông tin: sử dụng toàn bộ hay riêng biệt các dữ liệu trên trang web của công ty TeleTrade như một nguồn cung cấp thông tin nhất định. Việc sử dụng tư liệu từ trang web cần kèm theo liên kết đến trang teletrade.vn. Việc tự động thu thập số liệu cũng như thông tin từ trang web TeleTrade đều không được phép.
Xin vui lòng liên hệ với pr@teletrade.global nếu có câu hỏi.
ngân hàng